If you are looking for a SonarQube alternative, read below to find out more about similar tools, like Waydev, Jellyfish, and Okay.
One of the ways to deliver better software faster as an engineering leader is to make decisions supported by data. Traditionally, engineering management used to rely on gut feelings when making decisions rather than objective data.
Git Analytics tools help CTOs, VPs of Engineering, and Engineering Managers, measure engineering performance objectively by automatically analyzing Git repositories and translating engineering activity into real-time software development metrics and reports, with the purpose of gaining a clear view of the organization’s engineering processes.
Using a Git Analytics tool will help engineering managers and executives gain a clear view of the organization’s software development process and drive it effectively. This comparison will help you determine what’s best for you and your organization when evaluating some of the most popular Git Analytics tools – Waydev, SonarQube, Jellyfish, and Okay.
These tools understand the initial friction involved with process changes, so they have done their best to streamline the onboarding experience. The registration process may vary. Some of these tools require a demo meeting before you can register, others require users to request a trial, and others offer open access to the trial. Learn more about each tool’s registration process below.
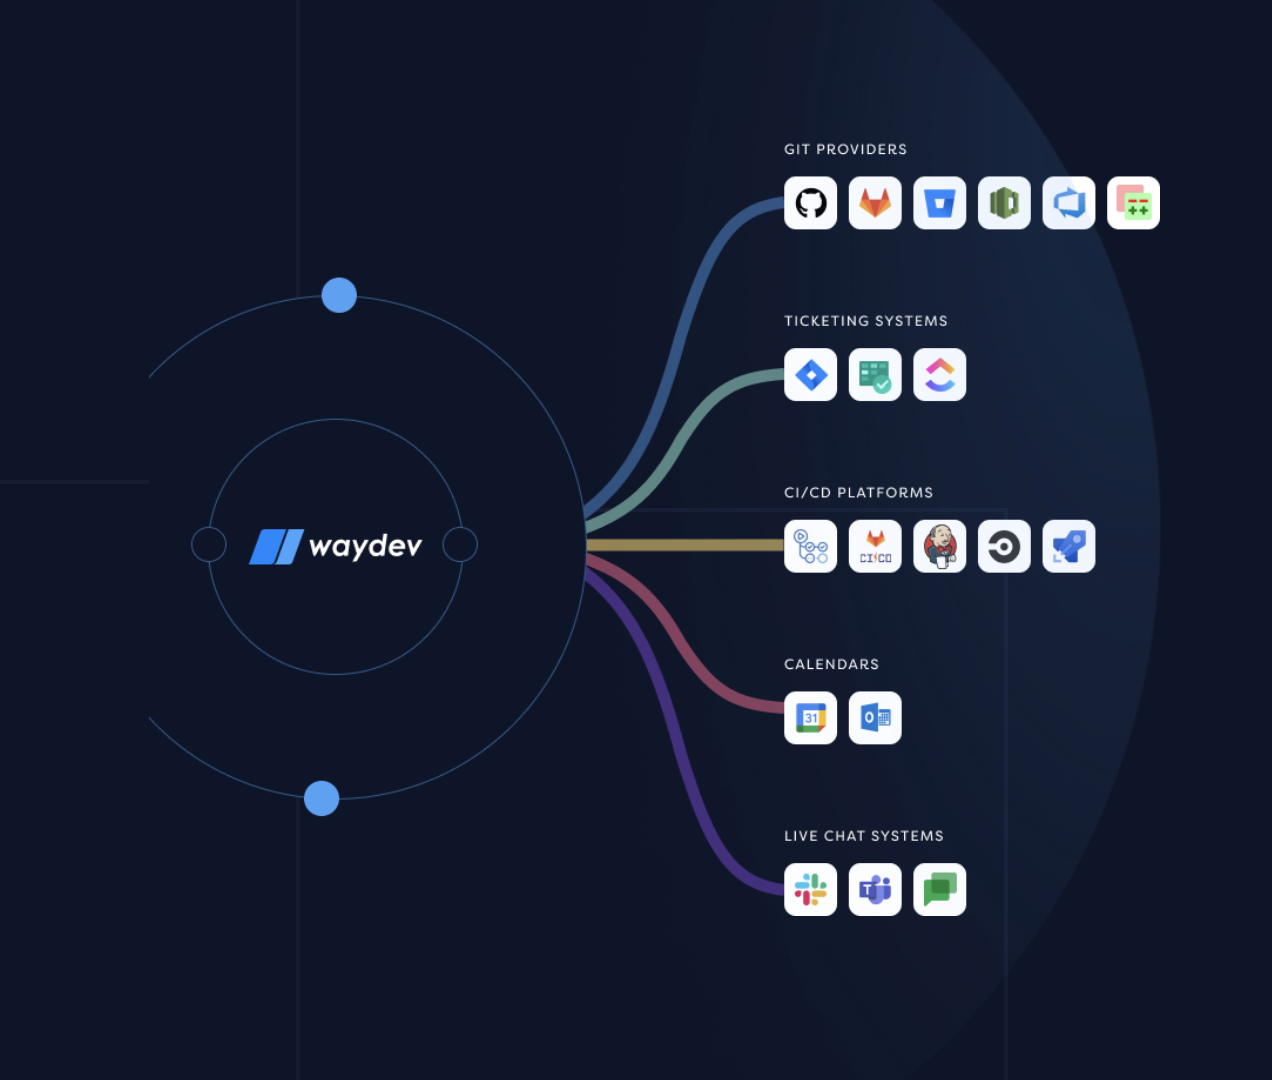
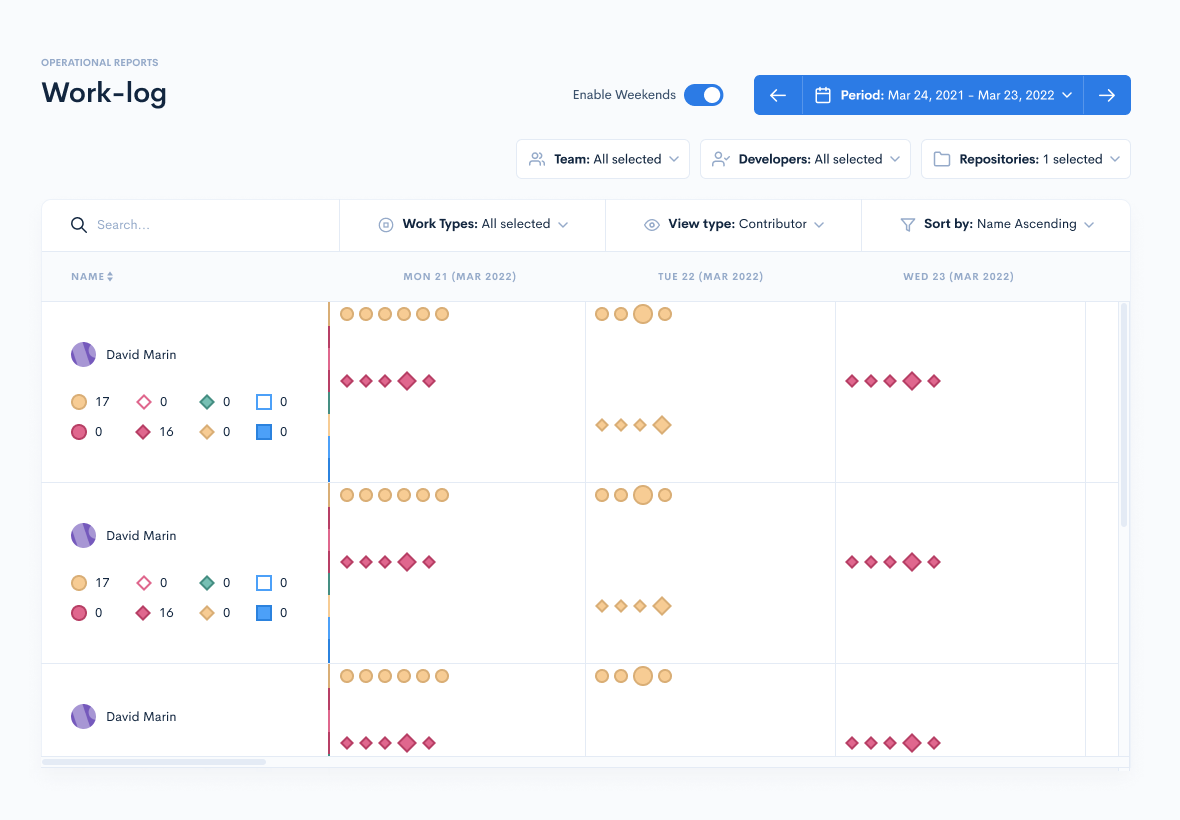
Right after your registration request has been approved, you can start setting up your account. After you sign in, you will be prompted to connect your Git repos. Waydev supports integrations with GitHub, GitLab, Bitbucket, and multiple other git providers, ticketing systems, CI/CD platforms, and calendars. After you connect to your tool stack and authorize Waydev’s access, you will be able to see your engineering data in the app.
Here’s how Waydev is a more holistic platform as compared to other tools:
Unlike Waydev, SonarQube does not require users to request a trial for the non-commercial version: it’s a free Community Edition. You may simply download the latest version and get started by installing an on-premise production instance. It’s worth noting that SonarQube offers a sister service in the cloud called SonarCloud. After installing the on-premise instance, you’ll need to set up SonarScanners on the machines where analysis will be executed.
SonarQube integrates with GitHub, GitLab, BitBucket, SCM, Jenkins, AzureDevOps, and Codemagic, and unlike Waydev, with no ticketing system like Jira, ClickUp, etc.
Before you register for a trial with Jellyfish, you are required to book a demo. After your registration request is approved, you are required to set up the integrations. Similar to Waydev, Jellyfish integrates with GitHub, GitLab, and Bitbucket as Git hosting tools. Jellyfish also integrates with Circle CI and Project Management tools, such as Jira, Aha!, and Productboard.
There are some shortcomings in Jellyfish:
Okay, different from Waydev, SonarQube, and Jellyfish offer open trial access. To set up your account, they only require a Google Calendar account. In terms of Git hosting tools, Okay only supports GitHub. They also integrate CircleCI and PagerDuty. After you set up the integrations, your data is delivered through a concierge onboarding session.
But just like Jellyfish, Okay lacks some key features:
Waydev, SonarQube, Jellyfish, and Okay, provide similar data sources, the difference being made by the focus of their data and the level of knowledge they provide.
Transparency is key for data-driven engineering management. Getting complete information from your Git Analytics tool is crucial. This means that a Git Analytics tool should pull data from code commits, pull requests, and tickets. We highlighted the data sources for each of these tools, so you can decide which is best for your organization.
Waydev is designed to import data from the most popular Git applications, such as GitHub, GitLab, BitBucket, Azure DevOps, AWS Code Commit, and also multiple ticketing systems and CI/CD tools. Their focus is evenly distributed across code-level metrics, code review insights, and ticket data.
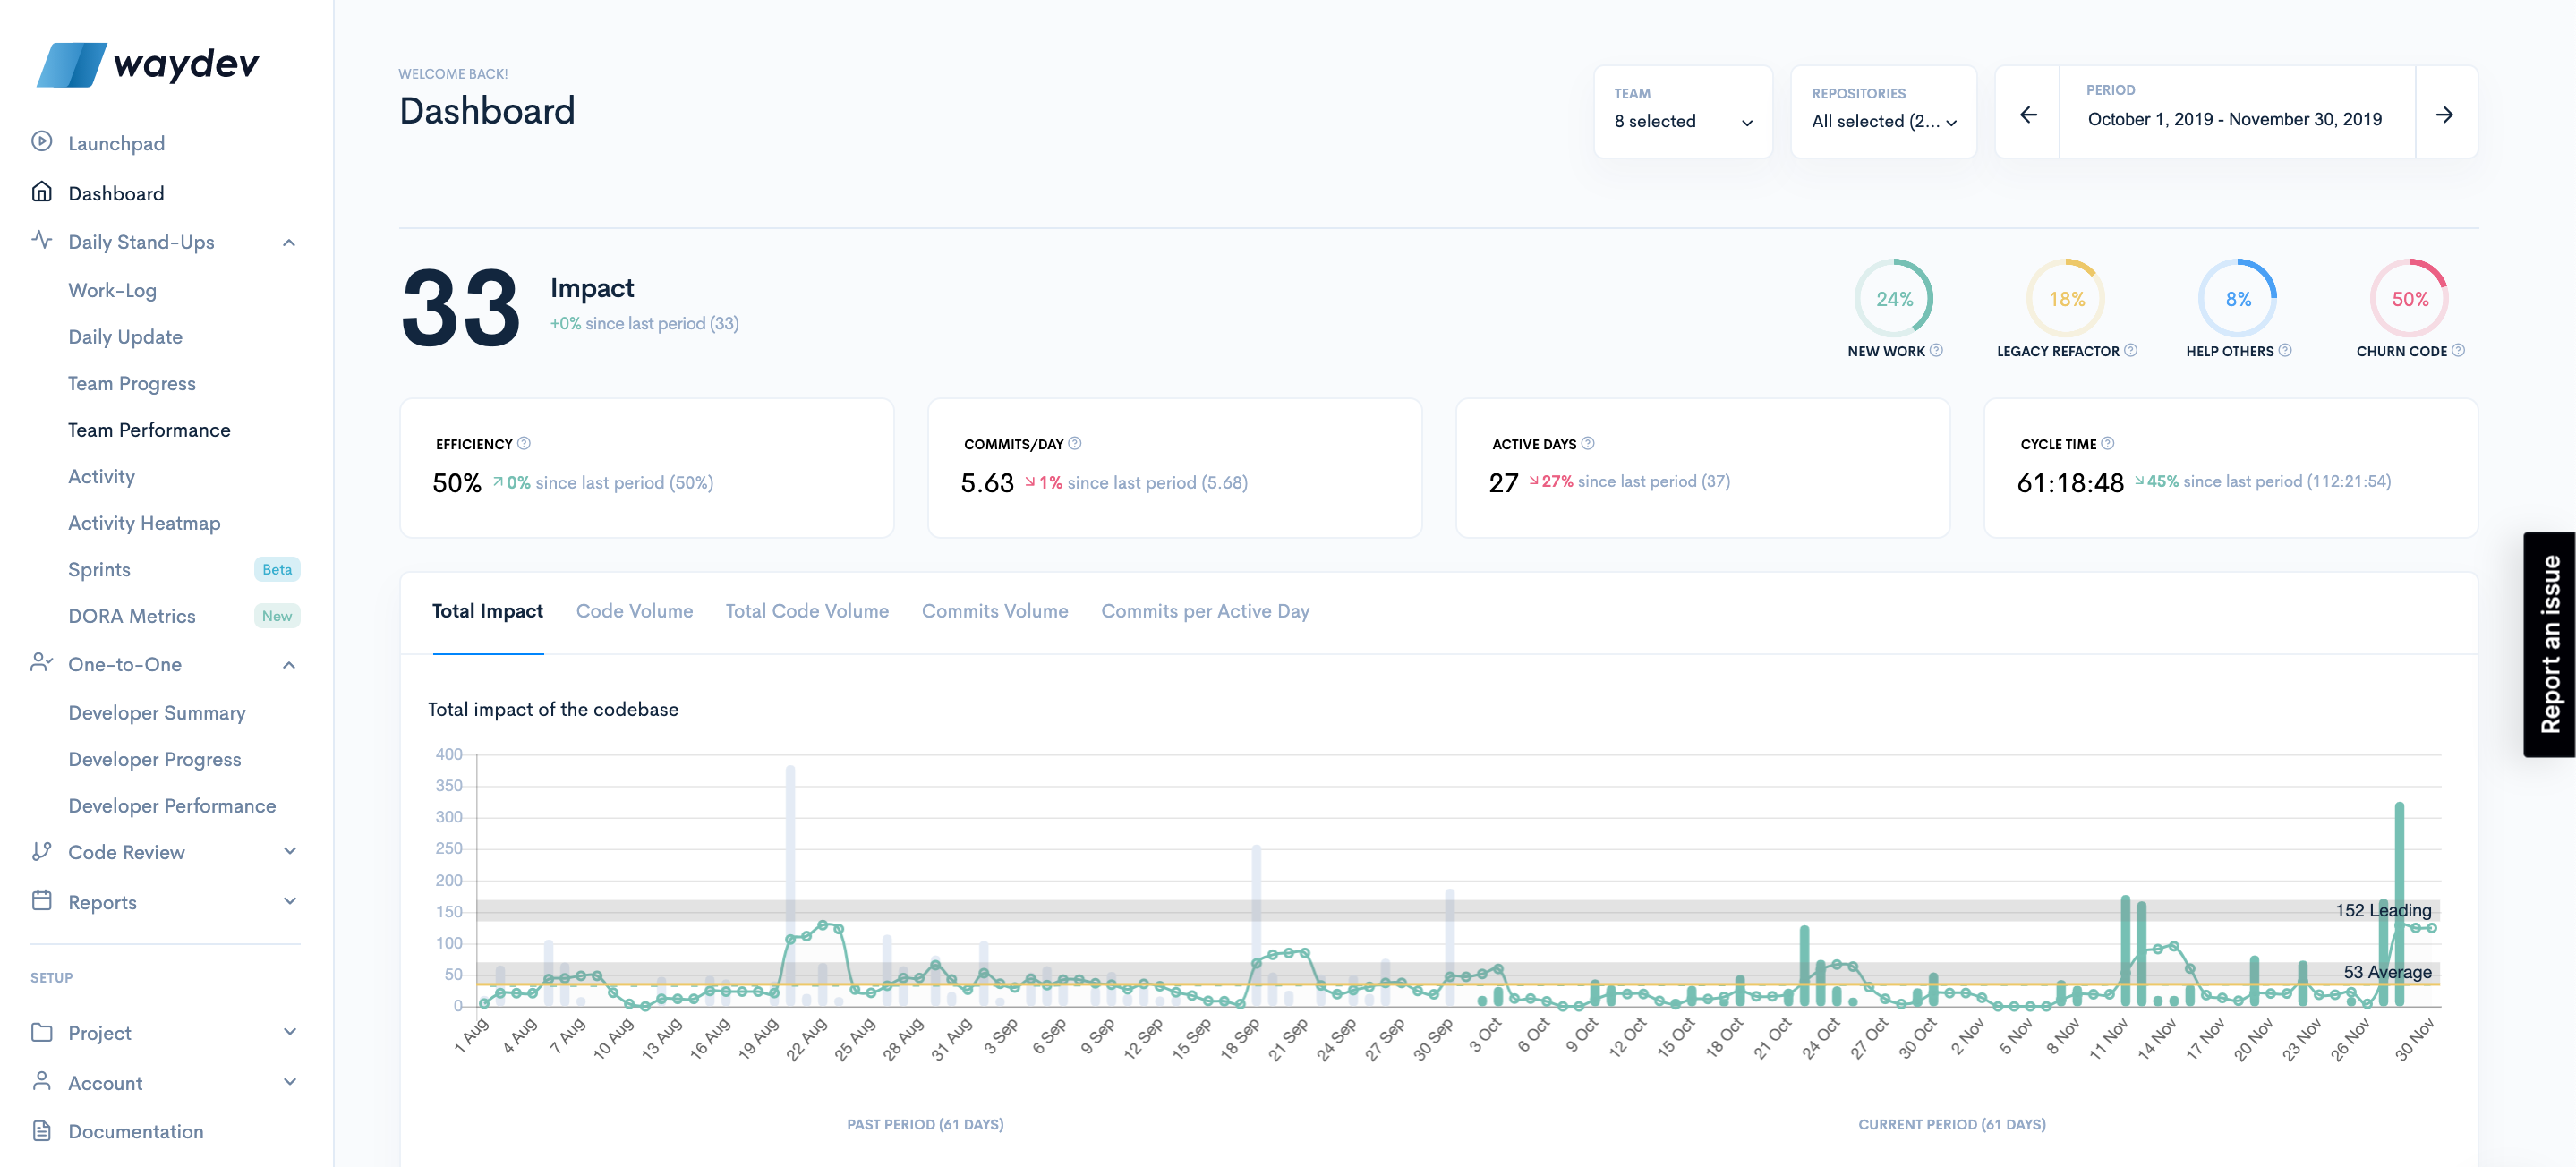
Waydev measures code complexity through the Impact metric. The Impact takes into consideration data points, such as the amount of code refactoring done, the number of edit locations, the number of files affected, and how the edit compares to historical changes. Through the Impact metric, Waydev helps engineering leaders correlate engineering output to business value.
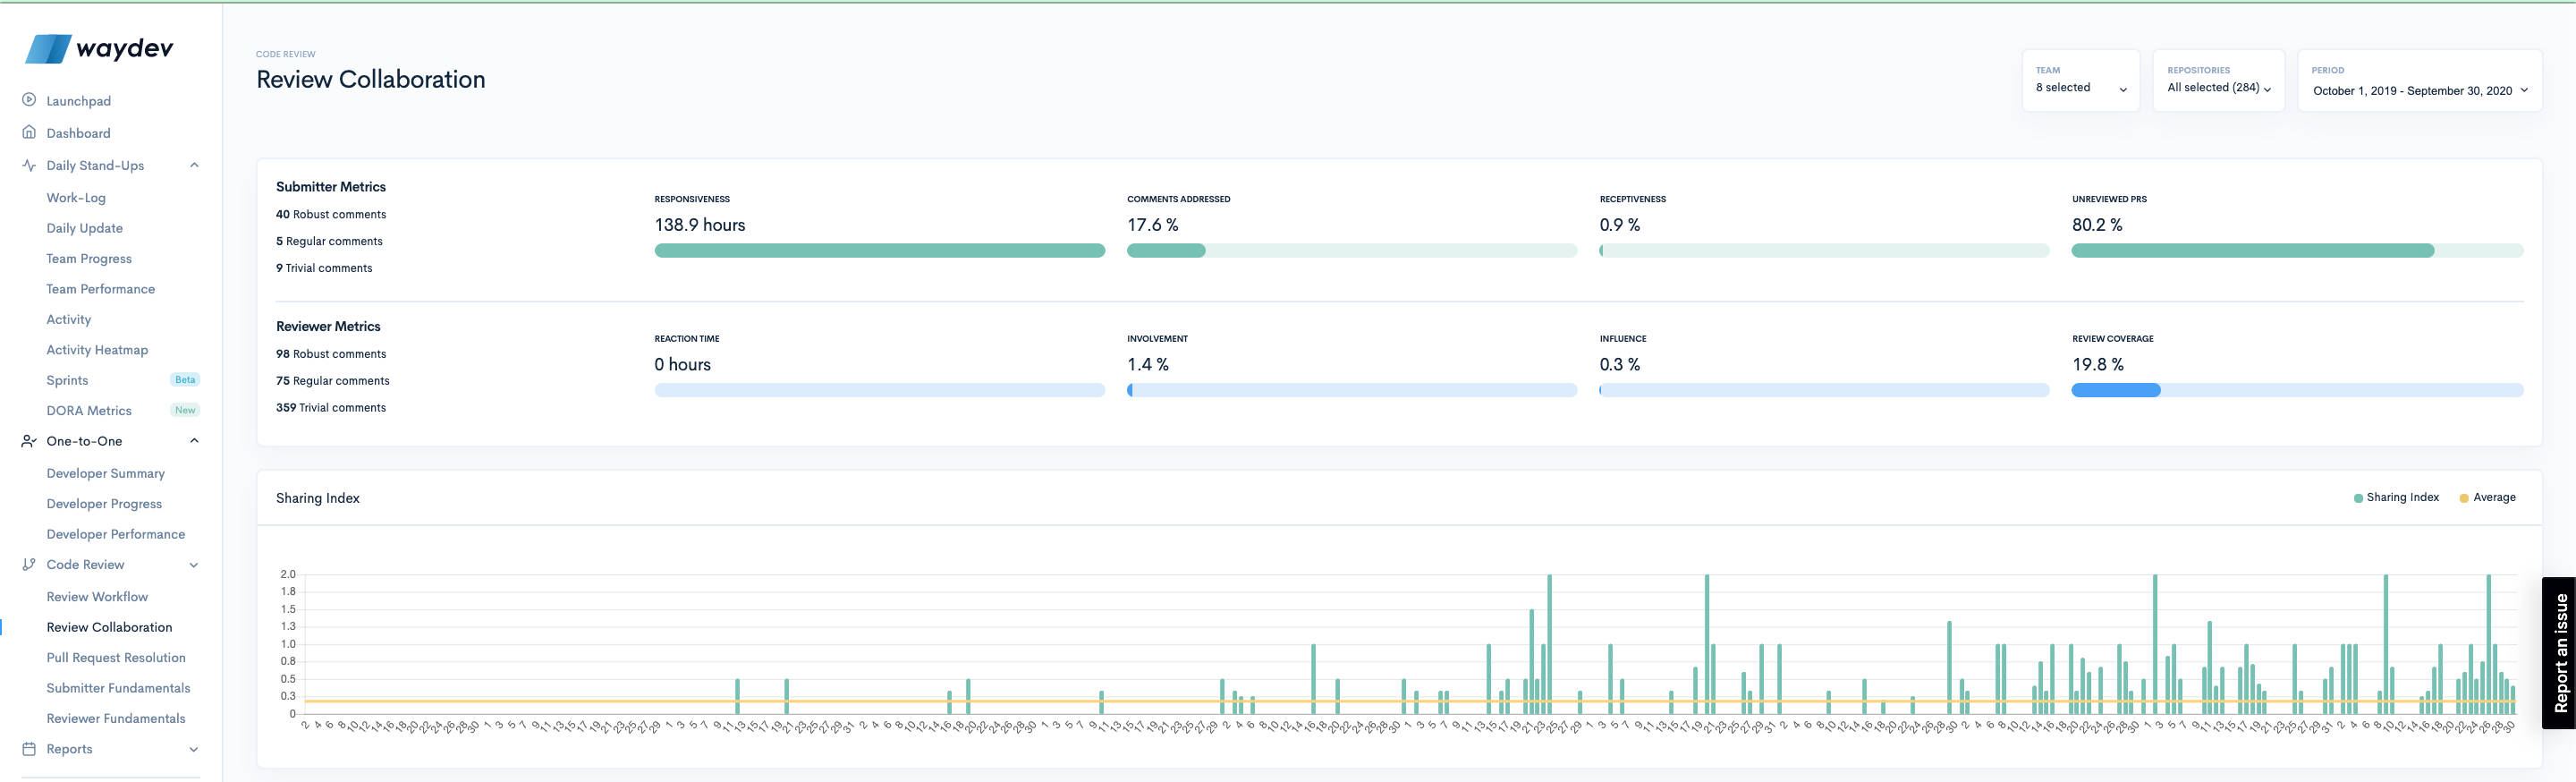
To measure the velocity of the code review process, Waydev uses the Responsiveness and the Reaction Time metric, while the Unreviewed PRs metric acts as an indicator for the quality of an organization’s code review workflow.
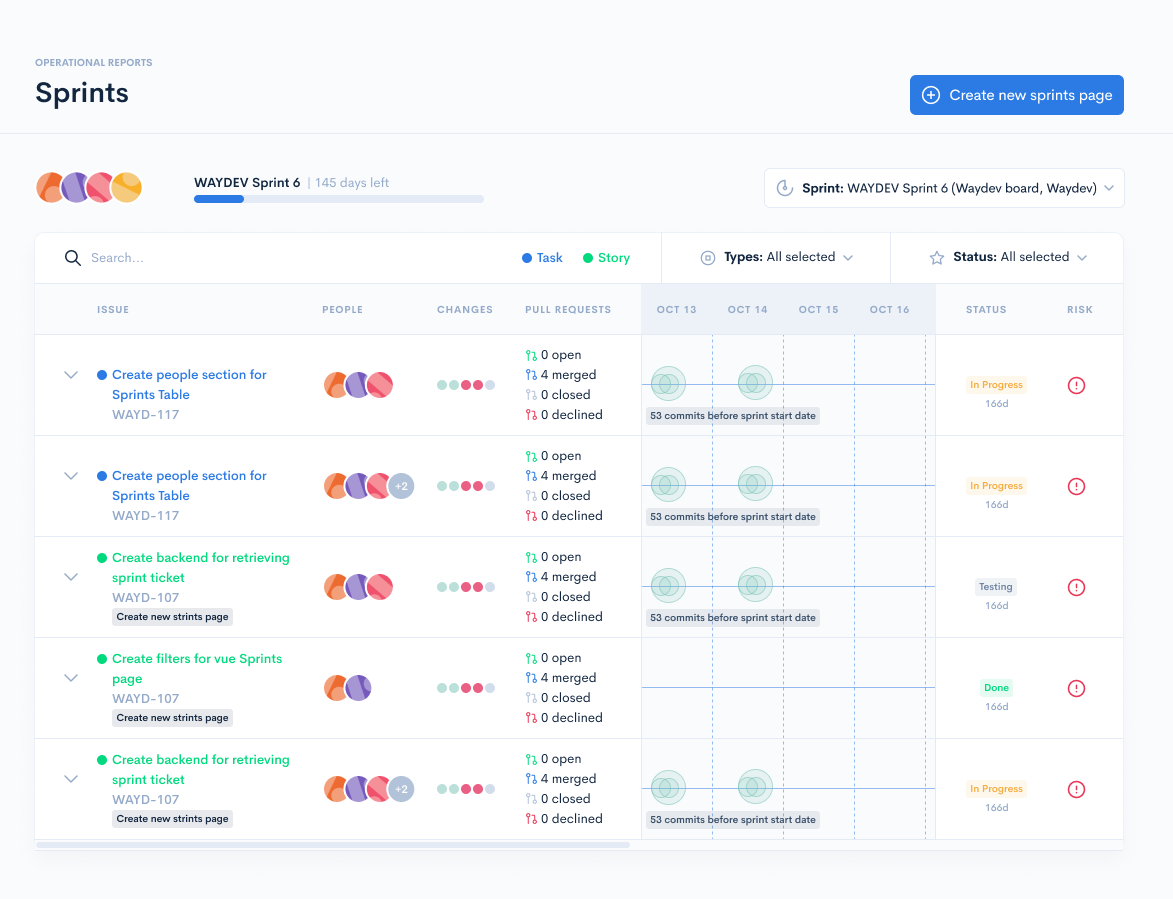
Waydev aggregates data from Jira tickets to create a forecast of your sprint risk. The sprint risk forecast is calculated based on historical and present data points. Waydev’s sprint risk forecast is designed to visualize where team members may be over capacity or falling behind with work.
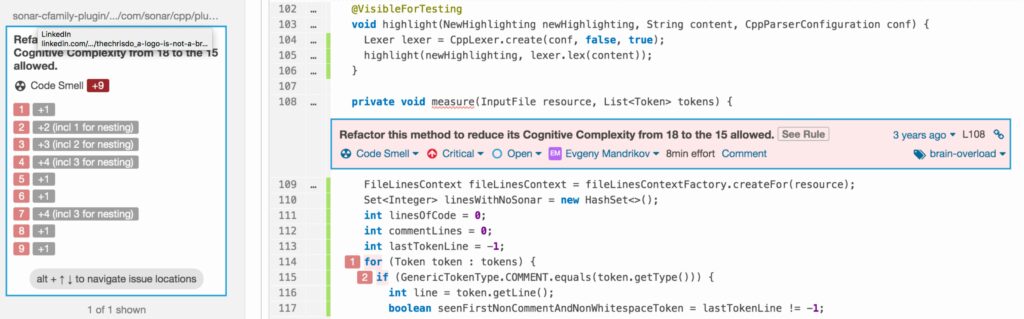
One of the things measured by SonarQube is the complexity of the code. It supports both Cyclomatic Complexity, which gives a minimum number of tests to cover the code fully, and Cognitive Complexity, a metric developed by that company to measure the ease of understanding the structure of the code. The programming language used slightly influences the calculation process because keywords and functionalities differ from language to language.
SonarQube offers a number of other metrics, but among the most significant are Security and Reliability ratings, as well as measurements of test coverage and duplications.
Jellyfish promises users complete visibility into the work of engineering teams through the metrics they obtain by analyzing data from Git repos, Jira tickets, and CI/CD tools. The metrics that Jellyfish offers are oriented towards business and project management.
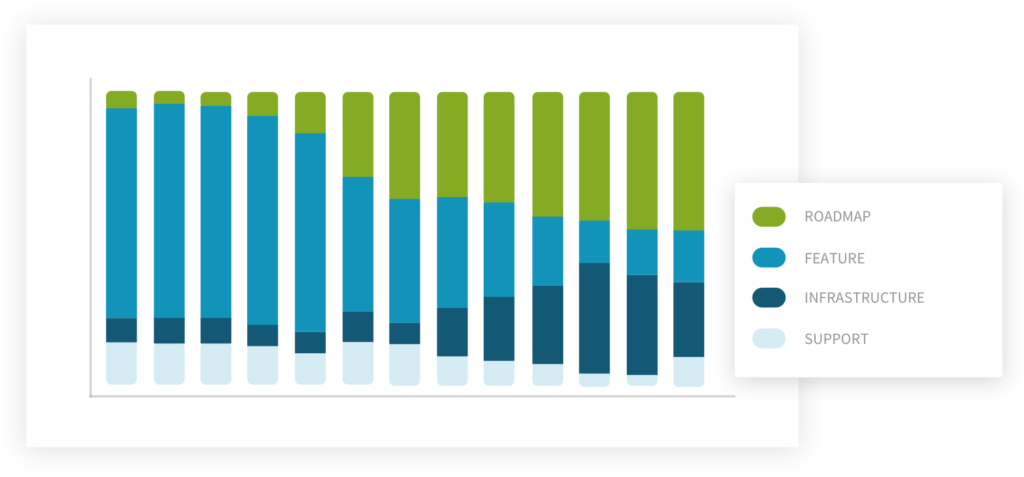
Investment distribution displays a breakdown of time spent for each work category – Roadmap, Unplanned, Infrastructure, Support, and Other. Jellyfish also displays a financial breakdown for each work category.
Jellyfish measures the velocity of development with the Issue Cycle Time and the PR Cycle Time. Their metrics help showcase information like how much time and financial resources are spent on paying down technical debt. Jellyfish focuses on how teams write code and manage their workload.
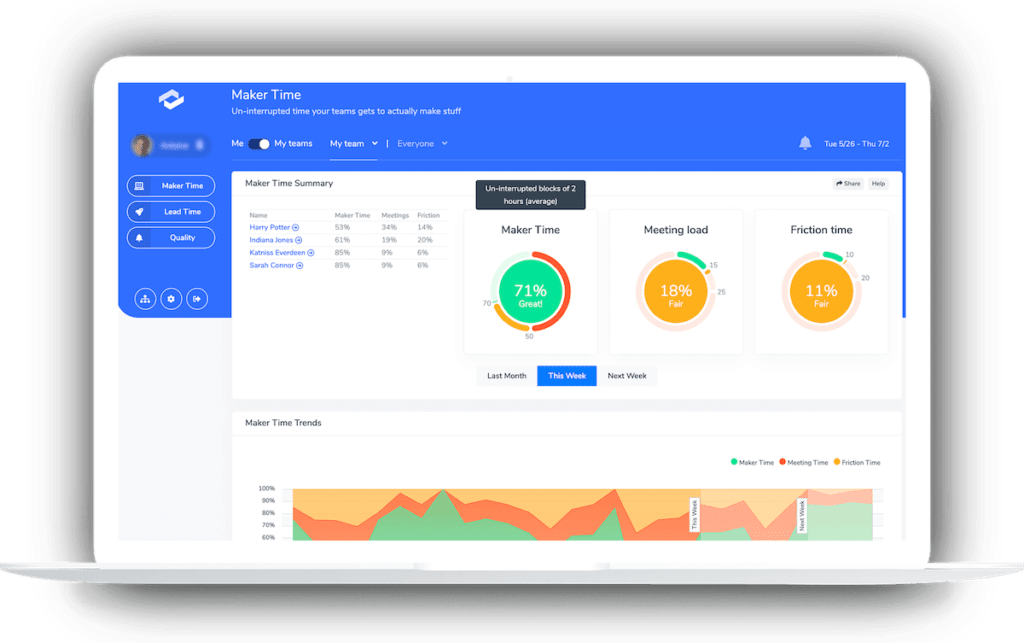
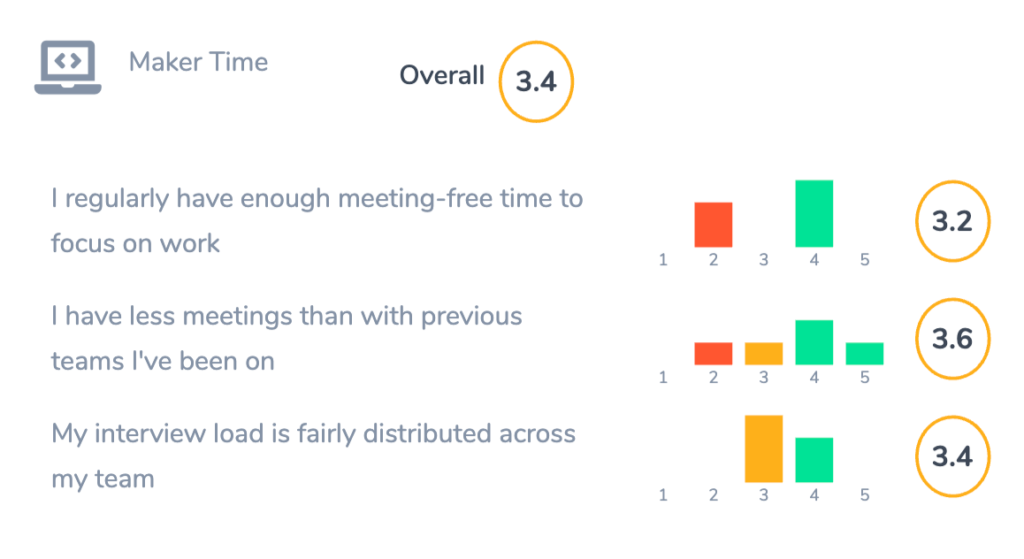
Okay data sources mainly consist of developer productivity metrics aggregated from the Google Calendar integration, CI/CD tools and Git Providers. For example, the Maker Time metric represents the number of uninterrupted 2-hour blocks in a workday.
Friction Time represents the gaps of less than 2 hours in-between meetings. Okay claims that this time is not long enough to go back into the ‘flow’ state. Alongside this metric, Okay proposes the Meeting Load metric, which represents how much time engineers spend in meetings.
Okay tries to remove team bottlenecks by providing engineering managers metrics like Review Time, which represents how much it takes for a pull request to be resolved, CI Time, and Lead Time, which gauges the review distribution across the team.
The code-level metrics of Okay are reported solely on a team level since they don’t support monitoring on an individual level.
Git Analytics tools aggregate and analyze Git repos into real-time reports and insights into how engineers work. They reduce the time engineering managers and executives spend on creating reports.
Waydev, Jellyfish, and Okay, are all meant to accomplish the same goal – provide engineering leaders with both team and high-level engineering performance reports. On the other hand, SonarQube is meant to help developers write better code. Engineering performance reports are explicitly not a goal of that product. The difference between those Git Analytics tools lies in the manner they present the data.
Organizations have different requirements for measuring engineering performance. In this section, we created an overview of how these tools track performance. Learn how each of these tools help you visualize data by reading below.
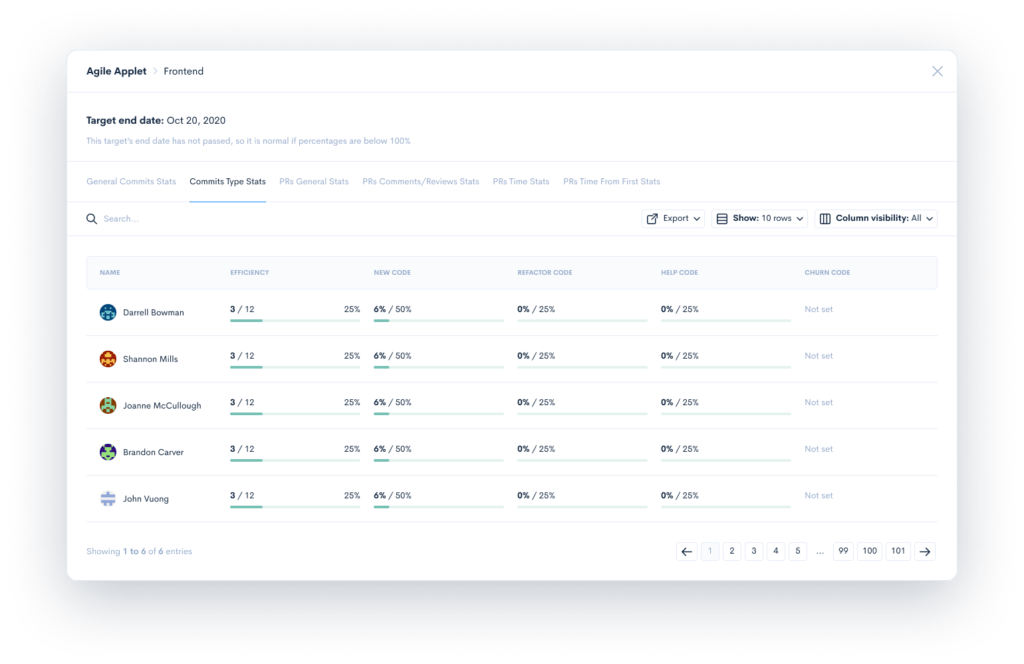
Waydev has multiple performance tracking tools:

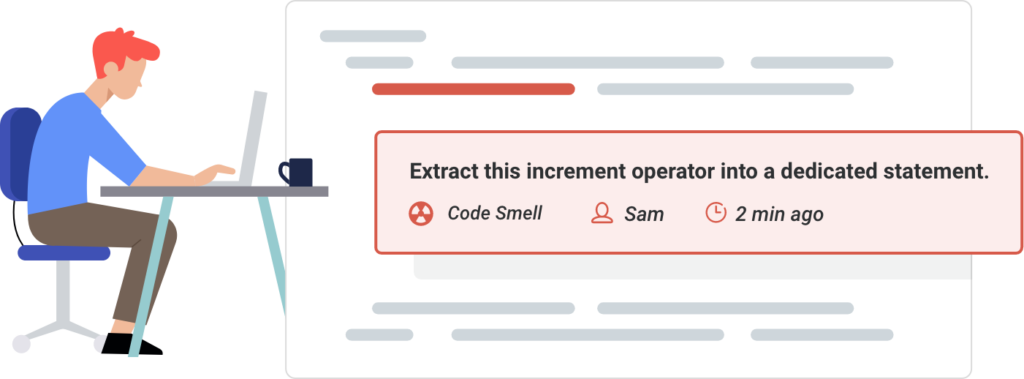
SonarQube is a more developer-oriented tool and wants to act as a mentor towards improvement and performance. They consider part of their mission to share the responsibility of code quality with engineers.
![]()
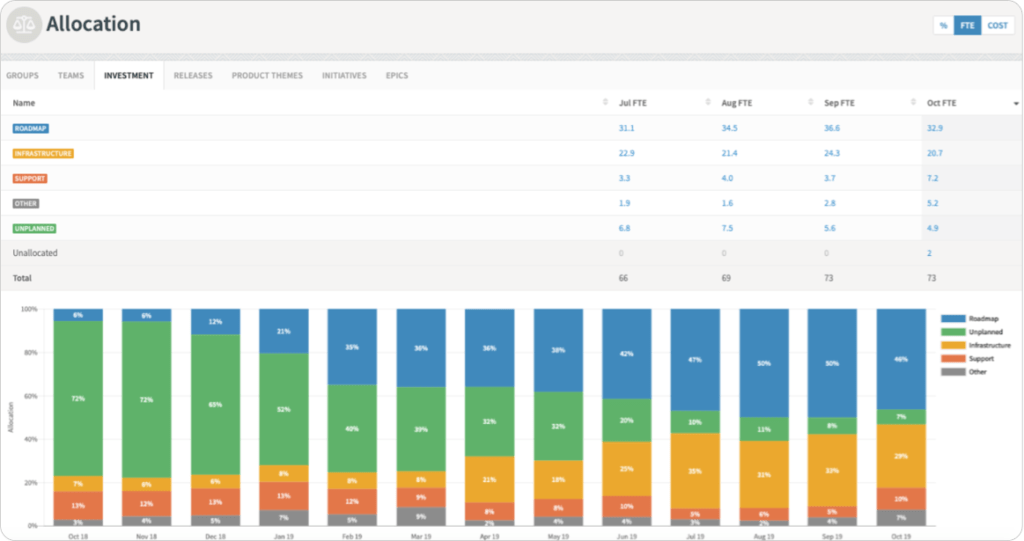
Alignment and productivity are two of the most important metrics for Jellyfish as they want to align the engineering decisions with the activity of the engineers. By using Alignment, you can see how the decisions managers make influence things like resource allocation or net gain in actual numbers and percentages.
![]()
By studying the Productivity metric provided by Jellyfish, you can find out if the work of your engineers is poorly categorized or if their time is occupied with too much low-priority work that you weren’t aware of. Jellyfish Allocation framework comes in handy for answering strategic planning dilemmas like how much should be invested in innovation, the cost of the resource allocation, and the overall cost of a project.
What Okay does is connect with the tools that engineering managers use and then produce dashboards that provide them insights into the performance of their team.
They rely on their superstar metric for this: Maker Time – the number of uninterrupted 2-hour blocks in a given day. In the end, we have to remember that while focused on productivity, Okay will focus primarily on project and time management for engineering teams.
In order to stay ahead of the game, you need to know how your teams are performing to locate the weak links in order to strengthen them. An opinion shared by the CEO of Jellyfish, Andrew Law: “Leaders need a comprehensive picture of their organizations now more than ever. In a world where software development has become the foundation of modern business, data-driven engineering insights are still scarce.”
If Waydev draws attention to team-related and work-related issues, Jellyfish and SonarQube’s approach is leaning on engineer-related problems, leaving Okay as the tool focused primarily on project management. All these differences are the result of the different methods used by each of these tools to detect unhealthy work patterns and process outliers
Waydev offers a wide variety of features that help you gain a better view of potential issues:
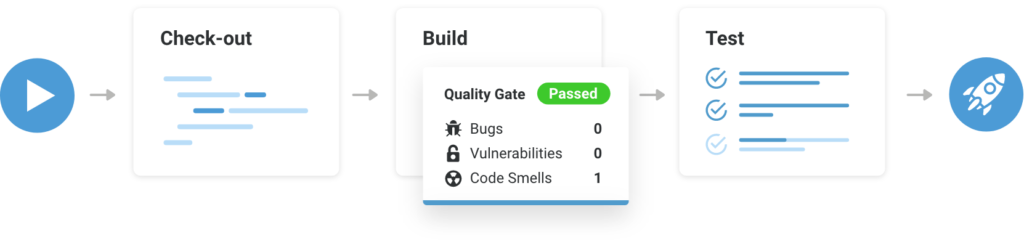
When it comes to locating problems, SonarQube’s approach includes the Branch analysis feature that is meant to help developers with the maintenance and scrutiny of branches. Alongside this feature, engineering managers can also use code quality metrics like Coverage and Duplication to locate blockages.
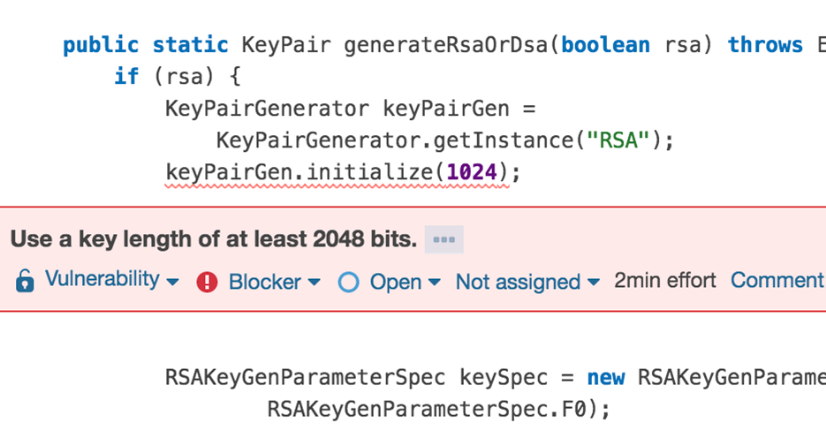
Check the UI is one of the functions crafted with the purpose of clarity in mind, so developers easily understand the problem flows from the vulnerability source to the code location (‘sink’) where the compromise occurs. You might also find useful the Check Issue visualizer that tracks untrusted user input throughout the execution flow.
Jellyfish allows engineering managers to explore metrics like Technical Debt and Product Pillars in order to locate the problems and check for misalignments between their goals and their performance.
By looking closely into Technical Debt, incremental performance can be addressed within teams that don’t spend enough time on technical debt or spend too much time writing bugs.
When it comes to locating problems, Okay comes with three metrics – Review Time, CI Time, and Lead Time, focused mostly on pull requests and how they are handled by the members of your team.
The default solutions that analytics tools present to their customers are a good fit for most, but it can happen for you to need to track specific custom metrics that have some unique requirements. When this happens, more flexible tools will be needed.
We are not being partial when we say that regarding the customization options, Waydev is the decisive winner, as it offers Targets, custom settings, custom reports, and role access personalization.
Waydev offers an API system where customers can create custom reports. Waydev also provides a Targets feature that helps translate uncovered opportunities to action by setting measurable targets within the application. Visualize and track progress to be able to hit your goals.
The Targets feature facilitates users to set custom targets on an individual, team, and organization level. You can track your goals and see the progress that has been made. Set event-triggered alerts and get updated in real-time via Slack whenever Waydev identifies spikes or drops in the metrics.
By using Settings, you can customize your Waydev reports. You can ignore particular file extensions, ignore commits based on a message, and ignore commits based on the number of LoC. It’s worth mentioning that your stats can be displayed according to the timezone you selected in the Stats Timezone section.
By using the Team Performance and Repositories Stats features in Waydev, you can create your own tailored reports. It’s very convenient, as users can create custom reports based on all Waydev metrics at multiple levels of granularity.
You can even go back up to 36 months when filtering by teams, repositories, and the selected period if you are interested in getting past insights or comparing the present performance of your team with the past one.
Moreover, Waydev can be set up to send weekly and monthly reports on your team’s performance, work focus, and many other metrics. These reports are stored and can be downloaded or viewed in the Reports History tab.
By using Waydev’s Role Management, you can provide granular access to each of Waydev’s features based on their permission levels.
The Stats Management feature enables users to grant custom permissions for users to view reports corresponding to their team or repository.
In terms of customization, SonarQube prides on being a minimal configuration needed tool.
Their tool has a SAST analysis engine that is configurable in Enterprise Edition (and above) that allows you to declare custom frameworks you can use to capture user input and/or persist it; and the injection flaw detection engine that tracks the non-sanitized user input is available in Developer Edition and above.
SonarQube doesn’t have any exporting capabilities.
What Jellyfish tries to do is answer the need of engineering leaders for a formalized approach and system for measuring engineering performance.
While accommodating in the terms of project load and the number of teams whose activity needs to be examined, in the other areas, Jellyfish appears to be a firm, standardized framework without many ways to customize the reports.
In terms of customization, Okay doesn’t deliver as much as the other tools we’ve analyzed. Their approach is much more simplistic and straightforward. Okay is strategy execution software, a dashboard for engineering leaders that helps them deliver projects faster and reduce interruptions for engineers.
The pricing models of Waydev, SonarQube, Jellyfish and Okay are quite different, as are the options they offer. Read how these Git Analytics tools stack up against each other in terms of pricing.
Waydev offers three pricing tiers: Pro, Premium, and Enterprise.
Waydev has three pricing tiers:
SonarQube Community Edition offers a free, open-source tool, meant to help developers individually start adopting code quality analysis in their CI/CD workflow.
Commercial Editions are priced per instance per year and based on the number of lines of code. Users pay per instance based on the maximum number of analyzed lines of code.
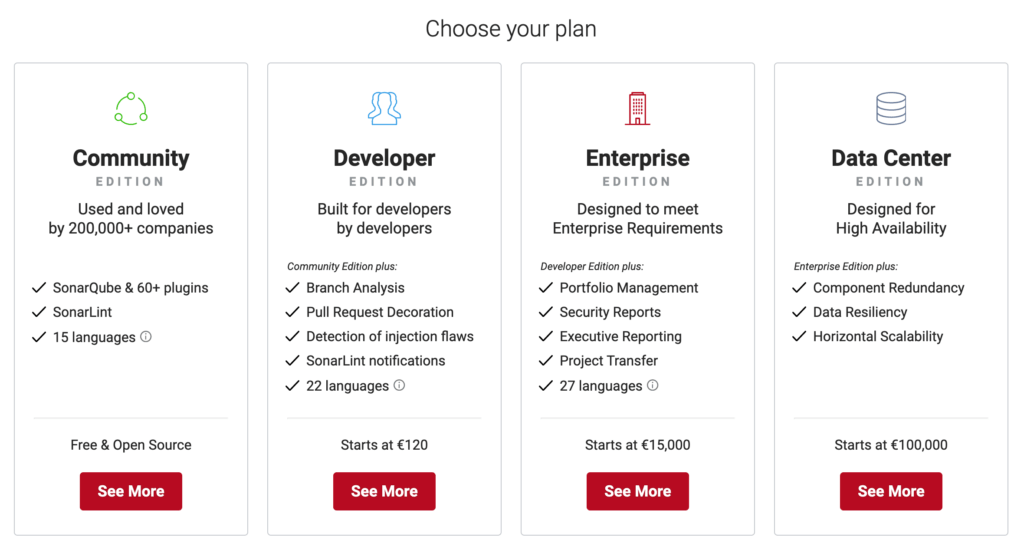
SonarQube Developer Edition is built on top of the Community Edition, with the addition of a few new features, such as branch analysis, PR analysis and in-ALM decoration, and detection of security vulnerabilities. SonarQube Developer Edition starts at a price of €120 per year per instance and can go up to €50,000 depending on the number of lines of code included in the license purchased. Support is billed additionally in the Developer Edition at a cost of €15,000. It is included free of charge in most higher editions.
SonarQube Enterprise Edition allows users to manage portfolios, transfer projects, and generate executive and security reports. This plan starts at €15,000 per year per instance and can go up to €180,000.
Lastly, SonarQube Data Center Edition aims to bring high availability for global deployments, by building on the Enterprise Edition, adding component redundancy, data resiliency, and offering included technical support. This edition starts at €100,000 per year per instance and can go up to €600,000.
Jellyfish pricing plans are unavailable publicly. Users are required to request a demo to learn more about their pricing options.
Okay offers two pricing plans: Starter and Enterprise. Okay, Starter plan starts at $95 per manager per month. This plan includes the Maker Time and Interview Load reports and supports up to 8 direct reports per manager.
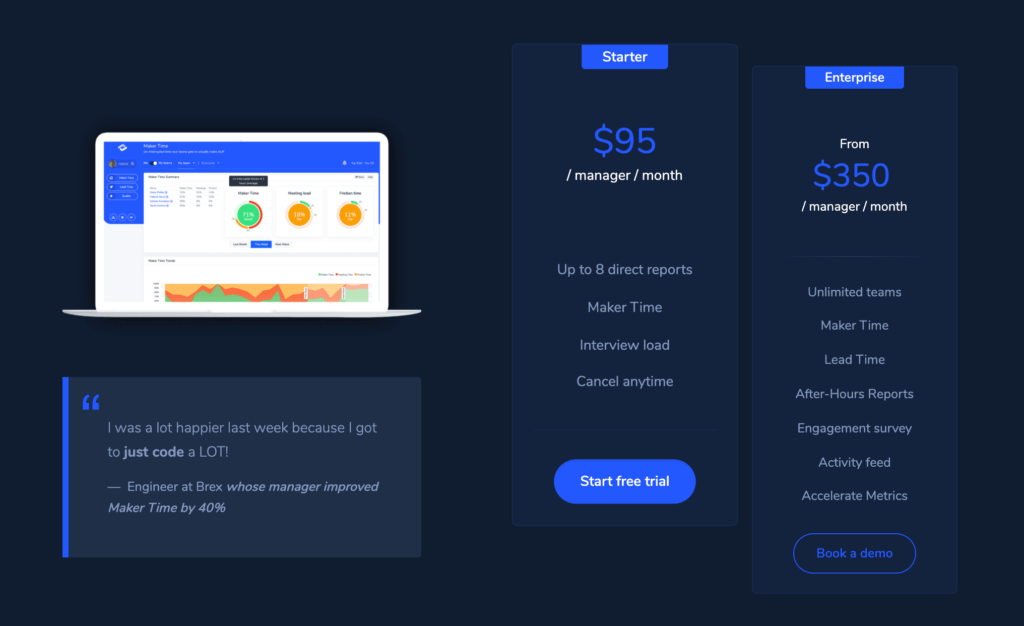
Okay Enterprise comes with the full functionality of the platform, including Maker Time, Lead Time, Accelerate Metrics, Activity Feed, After-Hour Reports, and Engagement survey, all available for unlimited teams.
Each of these Git Analytics tools has unique features that suit organizations’ different needs.
Waydev created a balance between code-level analytics, code review metrics, DORA metricsand project management insights. Waydev offers more customization options and enterprise-level access control. Waydev provides an array of functionalities, and more organizational layers can benefit from its flexibility.
SonarQube focuses on code quality and security. It doesn’t take into consideration individual and team performance metrics. The majority of its functionality is available in the free Community Edition.
Jellyfish is oriented towar the business aspect of software development, and Okay approaches the Git Analytics market from a non-disruptive perspective of doing software development.
If you are a SonarQube user looking to switch from SonarQube to Waydev, or perhaps you’re searching for SonarQube alternatives, this article will help you decide which of these tools is best suited for your needs.
Waydev and SonarQube are two of the best Git Analytics tools in the market. However, their use cases are different.
SonarQube is developer-oriented and focuses on code quality and security analysis. Waydev is designed for Engineering Leaders, CTOs, and VPs of Engineering. It provides a holistic view of the software development process.
If you want to find out more about how Waydev can help you, schedule a demo.

Ready to unlock your SDLC productivity?