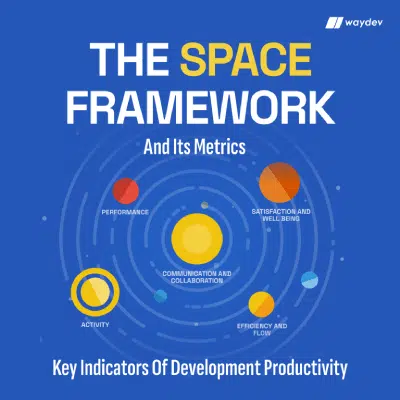





One view. Every engineering decision.
Bring AI adoption, software delivery, review quality, planning and engineering economics into a single executive dashboard. See the full picture without losing the detail behind each metric.
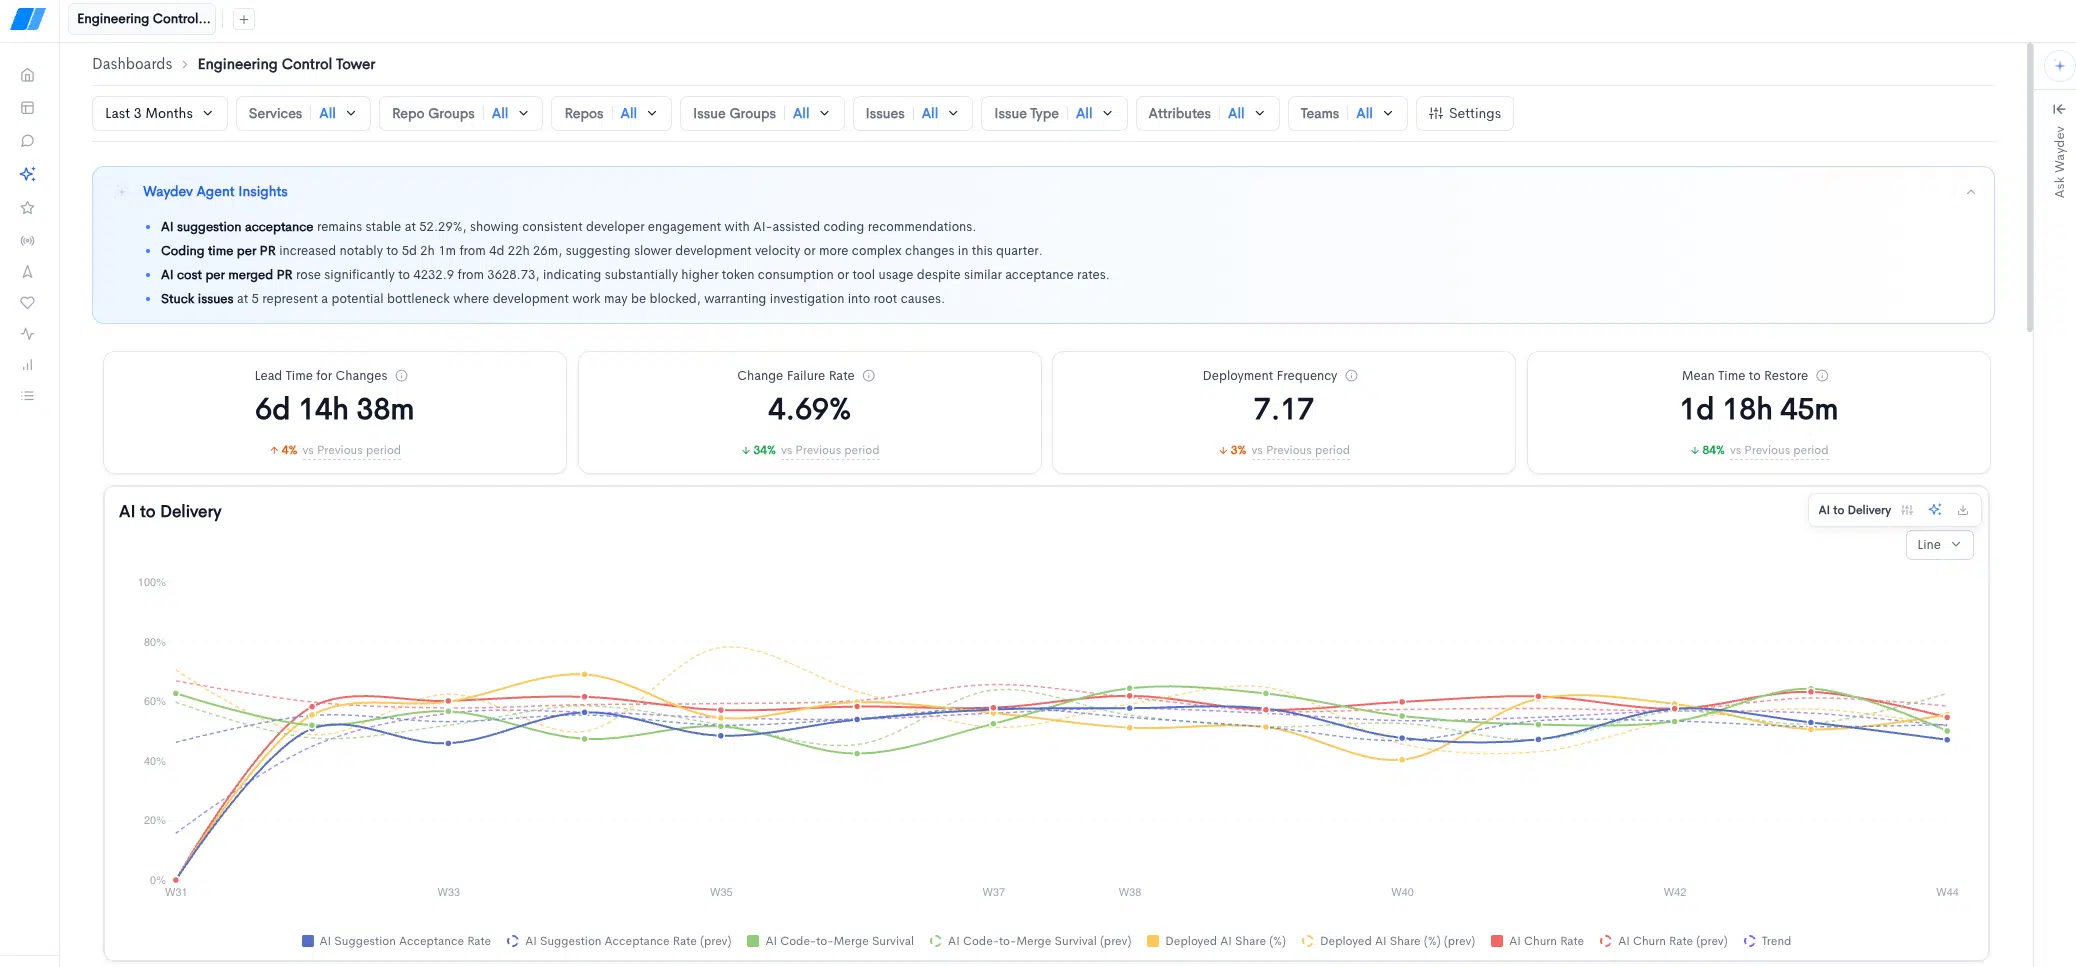
Real Waydev dashboard screenshot. Metrics shown are illustrative and may vary by organization.
Deliver with confidence
Bring DORA, AI-to-Delivery and Waydev Agent Insights together to understand where engineering performance is improving and where it needs attention.
- Follow lead time, deployment frequency, failure rate and restoration time.
- Analyze AI Suggestion Acceptance, Code-to-Merge Survival and Deployed AI Share.
- Use insights to investigate changes, not to assume causality.
Find the friction behind delivery
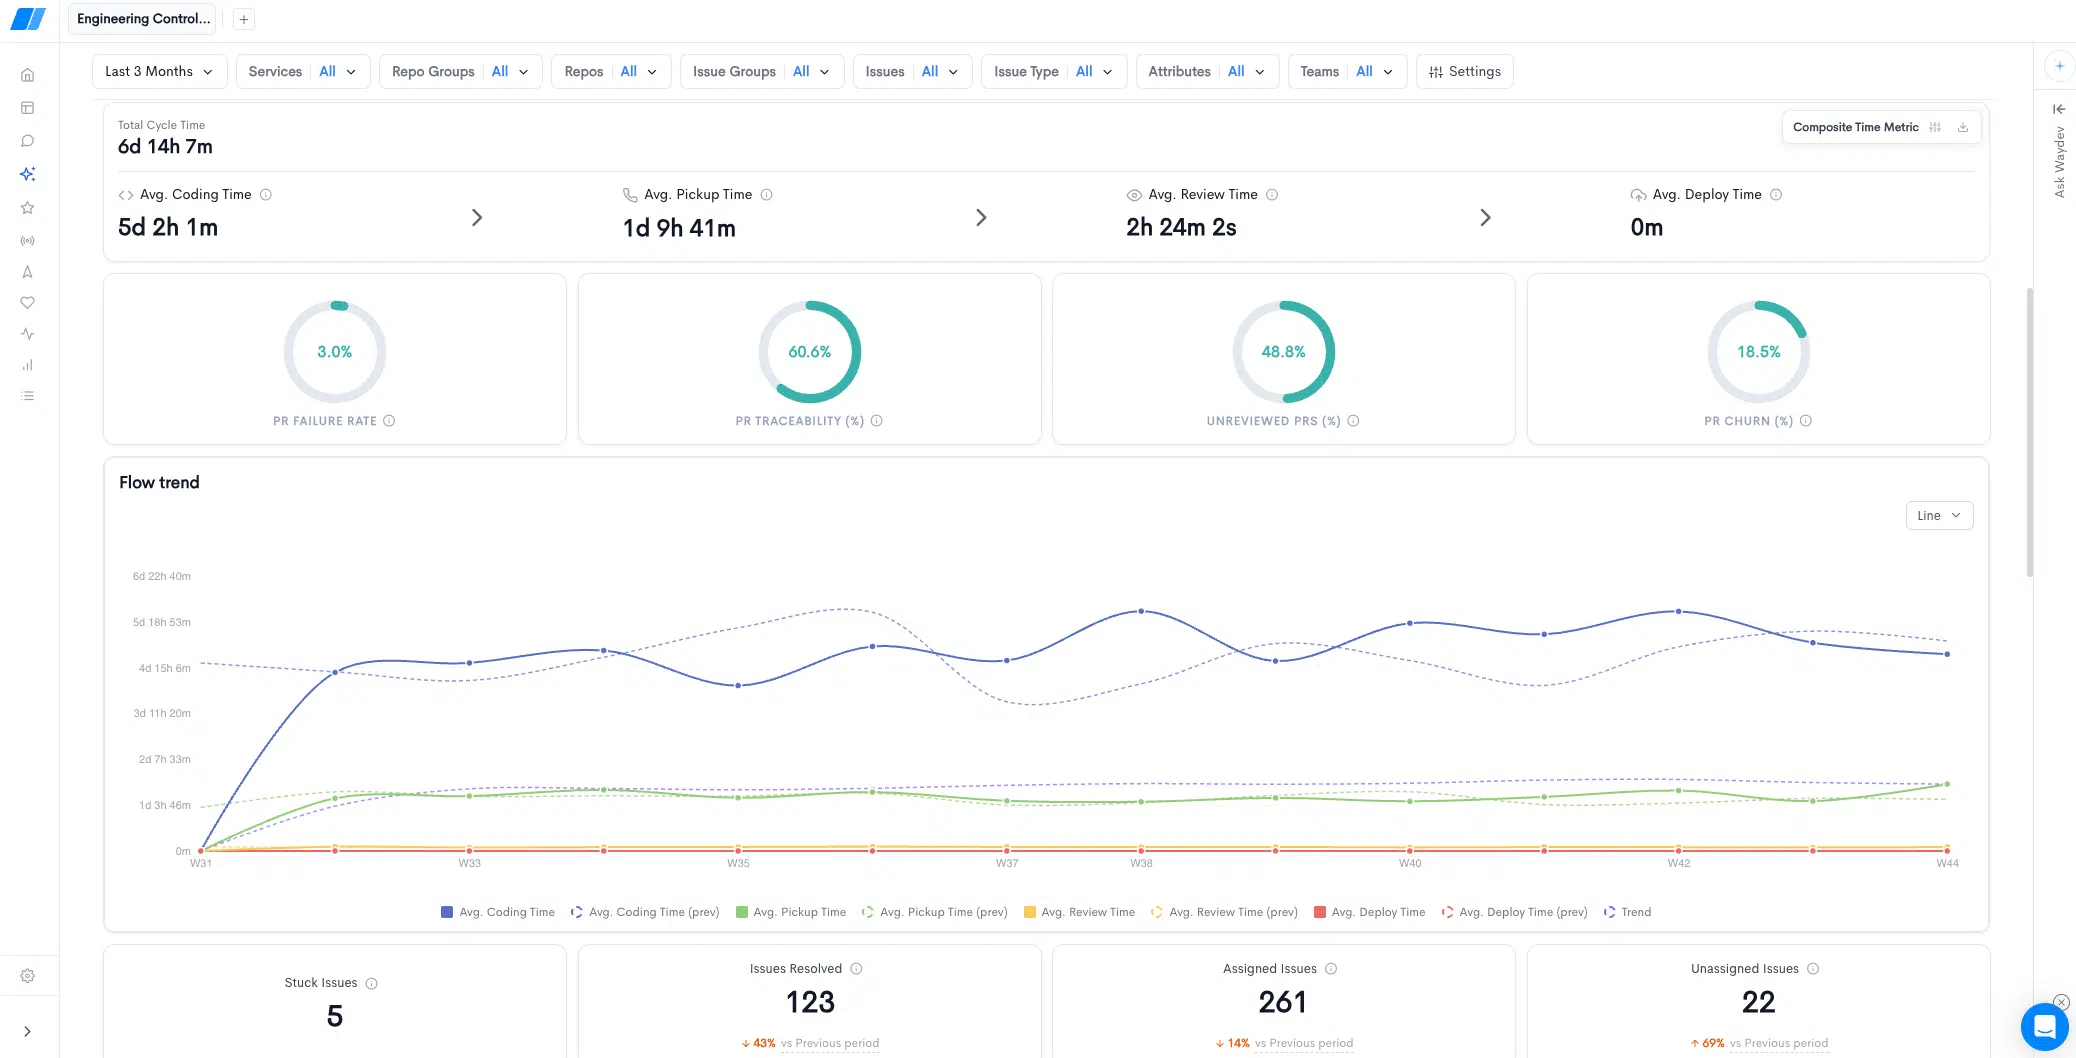
See coding, pickup, review and deploy time together, alongside delivery quality and traceability.
- Review flow trend and current-versus-previous period comparisons.
- Pair cycle time with PR Failure Rate, PR Traceability and PR Churn.
- Identify which bottlenecks deserve a closer review.
Bring engineering economics into the same conversation
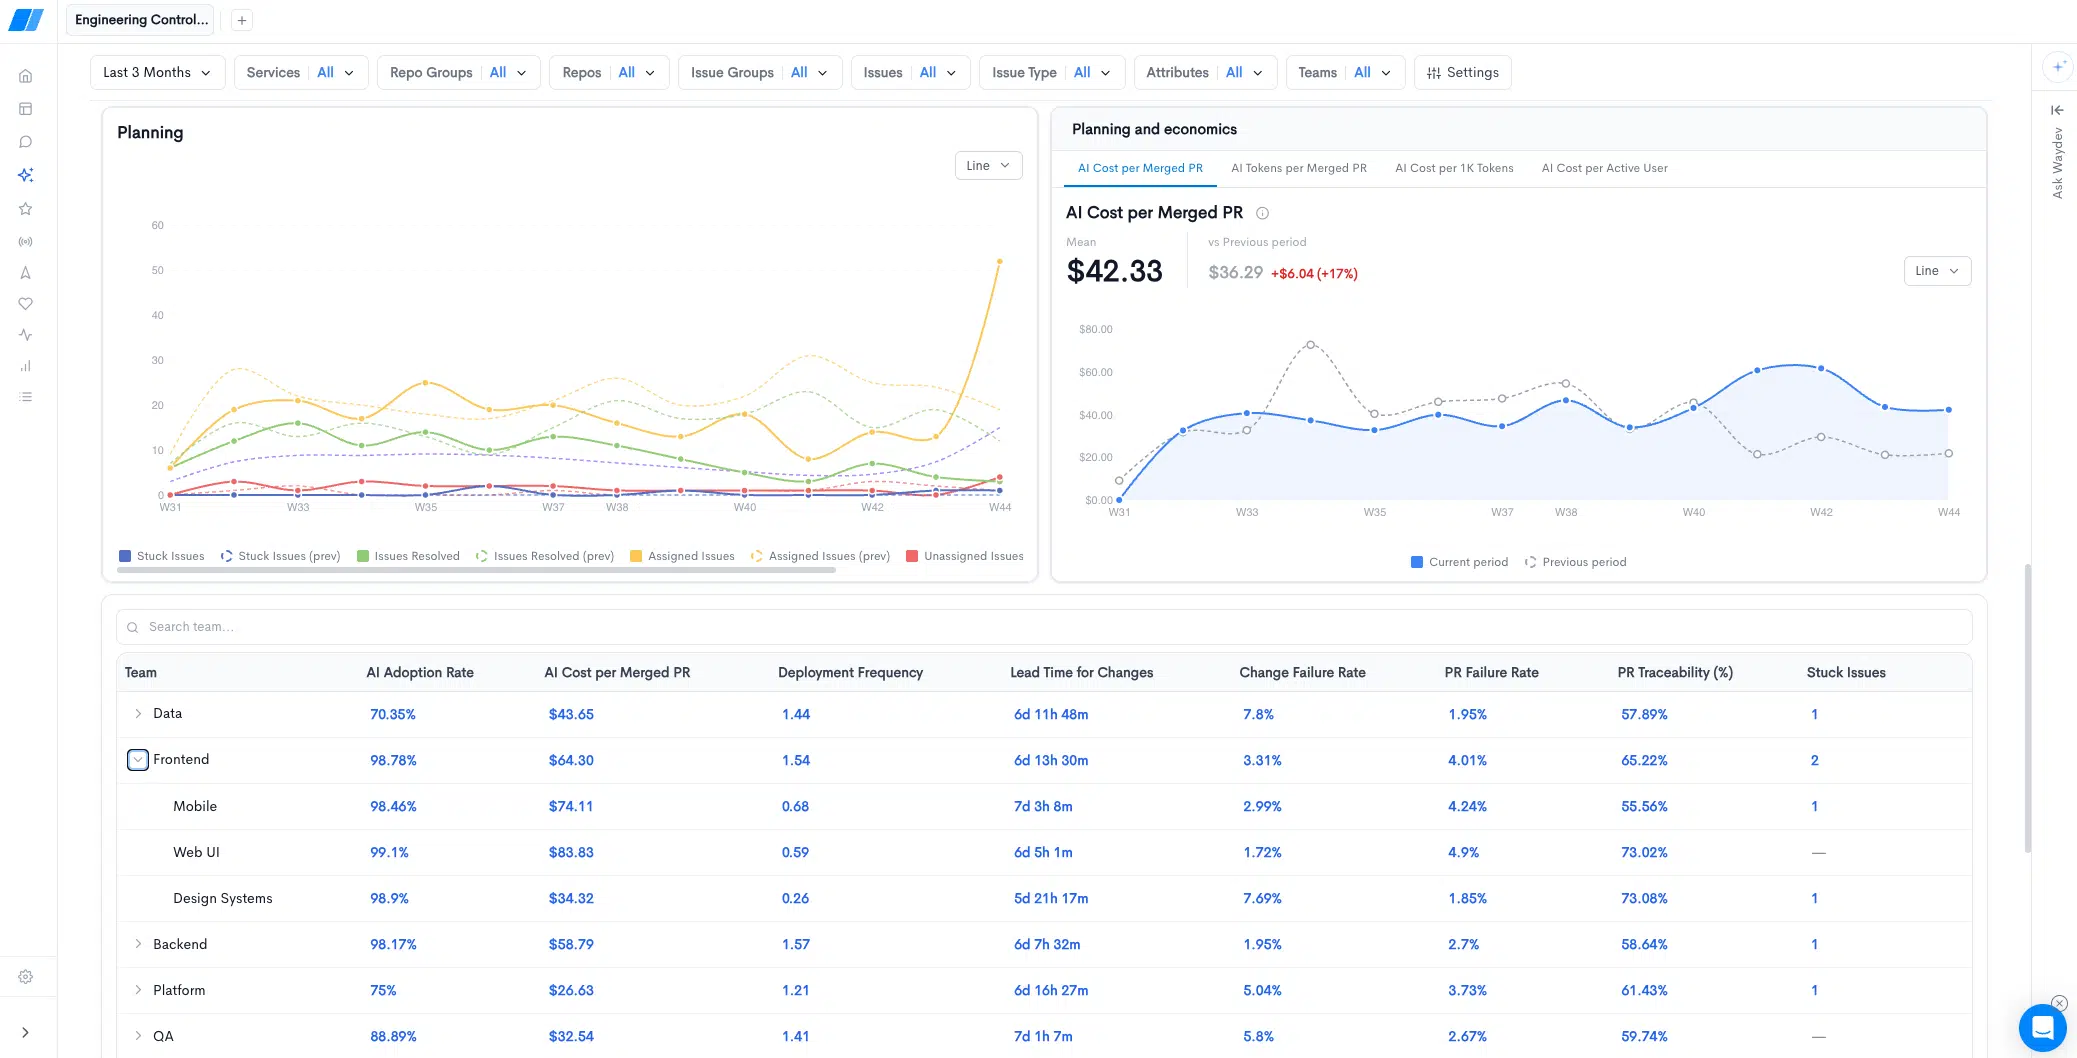
Combine planning metrics, AI spend and team comparisons to support more informed investment decisions.
- Monitor stuck, assigned, unassigned and resolved issues.
- Track AI Cost per Merged PR and related token economics.
- Compare team-level AI adoption, quality and delivery outcomes.
Better engineering decisions, grounded in your data.
Executive clarity
Use one view to align CTOs, VPs of Engineering and operational leaders.
Metrics with context
Inspect underlying teams and source reports, rather than isolated KPIs.
Flexible by design
Reuse Studio filters and existing Waydev measurement definitions.
See Engineering Control Tower in action.
Explore how Waydev connects engineering performance, AI impact, delivery quality and cost into decisions that matter.
Dashboard screenshots and examples are illustrative. Availability, metrics and integrations may vary by customer configuration.