
Measuring software development performance seems intangible for engineering managers, as the outcome is hard to quantify. From experience, professionals know that some quantitative metrics like lines of code, number of commits, or story points don’t reflect the actual status and quality. It negatively impacts it because it puts individuals and teams against one another, competing for results.
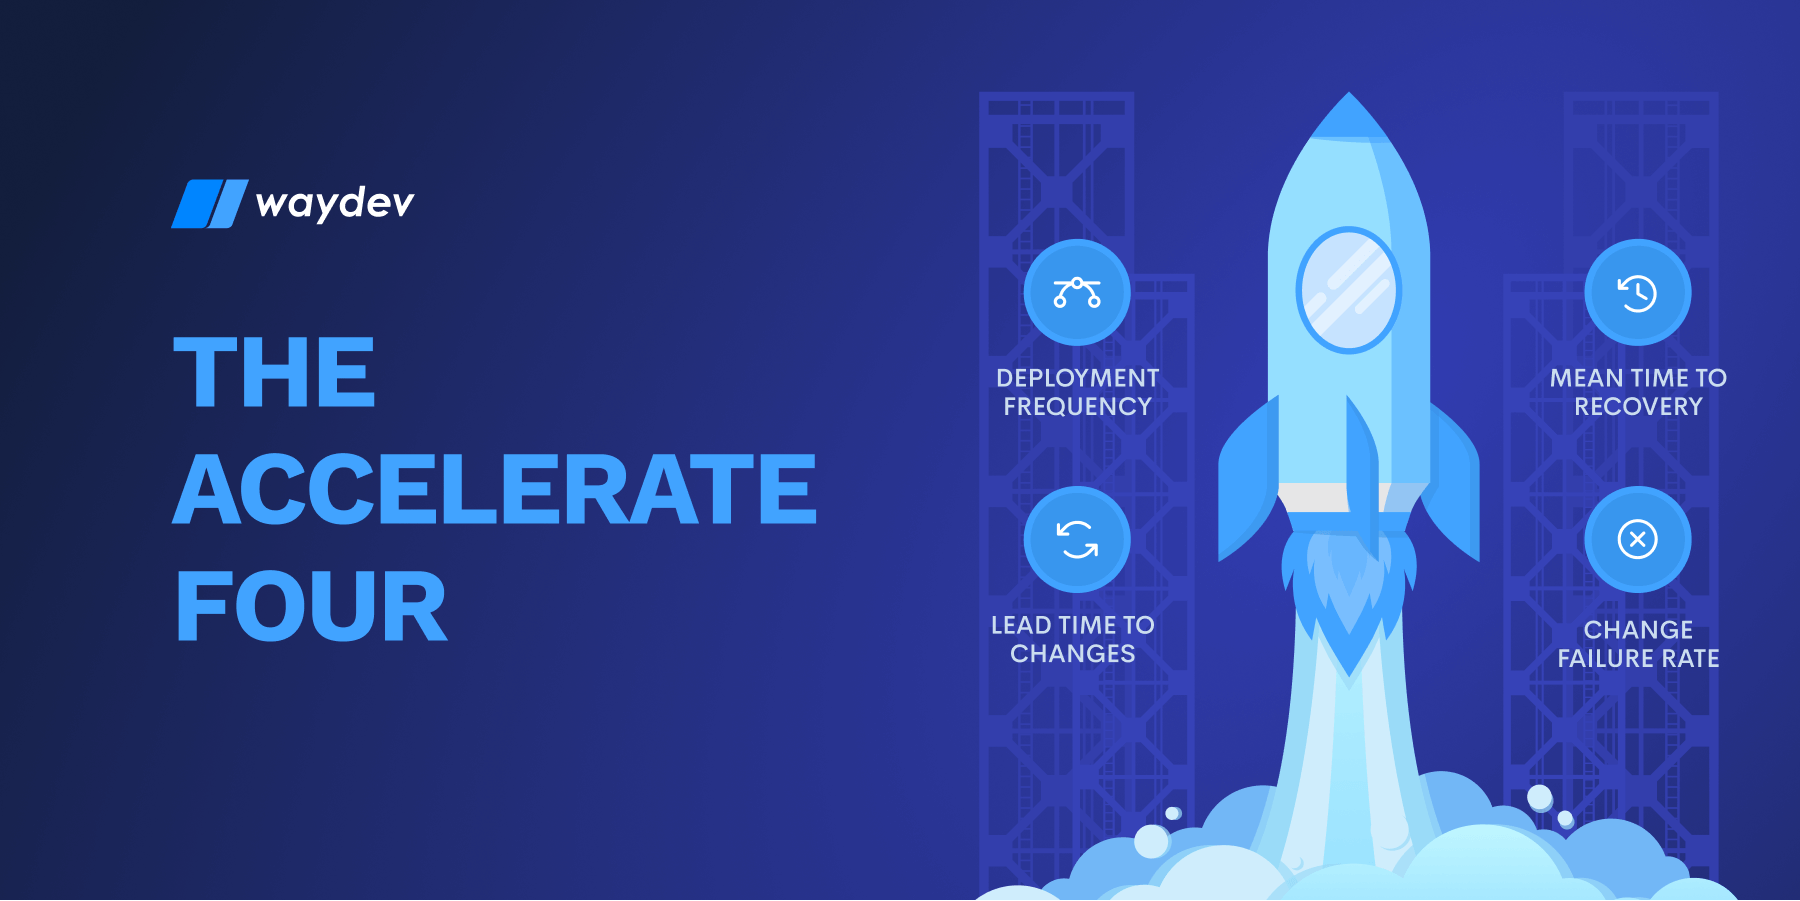
In this context, in their book Accelerate: The Science of Lean Software and DevOps, authors Dr. Nicole Forsgren, Jez Humble, and Gene Kim make a strong case for measuring software development performance by using only 4 key metrics: Deployment Frequency (DF), Lead Time to Changes (LTTC), Mean Time To Recovery (MTTR) and Change Failure Rate (CFR).
At Waydev, we understand that measuring software development outcome and performance is extremely valuable in improving and optimizing the engineering team’s results. We also know that if the assessment isn’t automatized and available to executives under easy-to-read reports, it might become an intimidating process that gets constantly postponed.
This material will offer you more information on the critical methodology and principles presented in the book mentioned above, get more in-depth on the Accelerate 4 key metrics, and showcase how you can measure them for valuable insights.
Written by Dr. Nicole Forsgren, Jez Humble, and Gene Kim, Accelerate: The Science of Lean Software and DevOps: Building and Scaling High Performing Technology Organizations studies the productivity models and strategies of companies that produce software. The book associates the idea of software delivery performance with organizational performance, linking the two through a direct relationship.
Accelerate is based on four-year research, which included over 23,000 respondents from more than 2,000 organizations, start-ups to Fortune 500, profit and non-profit organizations, digitally-native brands, and those required to undergo digital transformation processes. These businesses were involved in several industries, such as manufacturing, finance, agriculture.
Although the research was first published as a set of well-documented papers in worldwide journals, the book gathered the information, summarized it, and drew conclusions. As Accelerate mentions, the literature enables engineering managers to identify how to take projects from “committed to mainline” to “running in production” in just hours, compared to months.
To understand how to accelerate DevOps and make the most of the available KPIs, engineering managers have specific things they should take into account:
Lead Time and Deployment Frequency, the first two Accelerate metrics, are tempo metrics in the lean manufacturing industry. Their objective is to measure speed or throughput. The other two, Mean Time To Recovery and Change Failure Rate, are reliability metrics. They create a balanced approach, where speed and quality are analyzed together.
For the first time, this book supports the idea that sound engineering practices may focus on both speed and stability, thus bringing a layer of security and trust to processes that would, otherwise, be considered vulnerable and complicated.
Of course, no industry novelty will ever be received with enthusiasm, and Accelerate metrics are no exception. Measuring software development performance has long been considered impossible, and many believe it still is.
Engineering managers often say measuring performance is like assessing something intangible, invisible. They relate significantly better with productivity KPIs like Lines of Code, the number of commits, or story points quote. Still, these don’t give them clear indications over the actual throughput of team members or the quality of the deliverables.
Due to the diversity of companies studied in the research, the book supports the case that Accelerate metrics can be used in any company, no matter its size, type, structure, industry, or specificity.
As the three authors explain, it is less about the organizations’ specificity, and more about providing a supportive environment, where leadership helps teams understand and deploy the new model, guiding them through adoption.
Considering how to measure work, the authors believe that when different individuals or departments measure different metrics, they might compete against one another. This approach doesn’t benefit the project since it doesn’t foster collaboration and it silos teams.
To succeed, they encourage engineering managers to focus on the overall outcome at the team level instead of on each individual’s or department’s output. Professionals work together for a common goal and focus on quality and performance over quantity.
The four key metrics referenced in the book are:
Deployment Frequency answers the question “How often does the organization deploy into production?”. In classical lean manufacturing, the metric focuses on batch size, supporting the idea that smaller batches delivered more often increase performance. Since the batch is not tangible in software development, the book’s authors measured how often software is released. The metric is associated with the premise that a CI / CD pipeline team has fewer code changes and fewer commits to test, increasing performance.
Deployment Frequency is more of an Agile metric. It fosters innovation and trial, testing hypotheses so that companies release top features that benefit the end-user.
Lead Time to Changes answers the question, “How long does it take for a commit to be running in production?”. The metric focuses on a company’s technical capability, assessing the time spent deploying, testing, and delivering code for a specific product or feature. According to the authors’ theory, code provides value only when put in production. It is seen as inventory in all previous stages, data collection with no actual use.
This metric is improved and optimized in organizations that benefit from technological strength, optimal system design, integration, and delivery pipelines.
Mean Time to Recovery answers the question, “How long does it take a company to recover from a failure in production?”.
This metric has a strong premise: companies can’t avoid failures (capacity errors, security threats, expired certificates, or DNS issues), as these are normal consequences of having an overall active development environment, which is subject to changes. A company’s systems are bound to become inoperational occasionally, either partially or entirely, depending on the severity of the incident.
The question isn’t whether errors will arise but how fast professionals can restore a system to make it 100% operational. The shorter it takes for a failure to be solved, the higher the team performance and overall end-user satisfaction.
The Change Failure Rate answers the question “How often do a company’s deployments generate failures in production?”. CFR is an extremely valuable metric in lean manufacturing since it ensures that a company doesn’t focus more on production throughput than on quality. In software development, Change Failure Rate assesses whether software releases and new features generate issues or degrade performance.
The metric showcases how many of the changes performed lead to failures that impact the end user’s experience while disrupting the team’s delivery plans and flows because of unplanned work.
Once you decide that the 4 Accelerate metrics are an excellent way of measuring performance, it is time to go to the next step and focus on assessing them. Many of the engineering managers validate KPIs manually, which is extremely dreadful because it involves much data gathering, analysis.
The process they use is the following:
Of course, this in-house-made approach requires manual input, which takes time from the engineering manager, transforming it into a daunting task that might easily get postponed. This is why an automated solution would bring significantly more benefits.
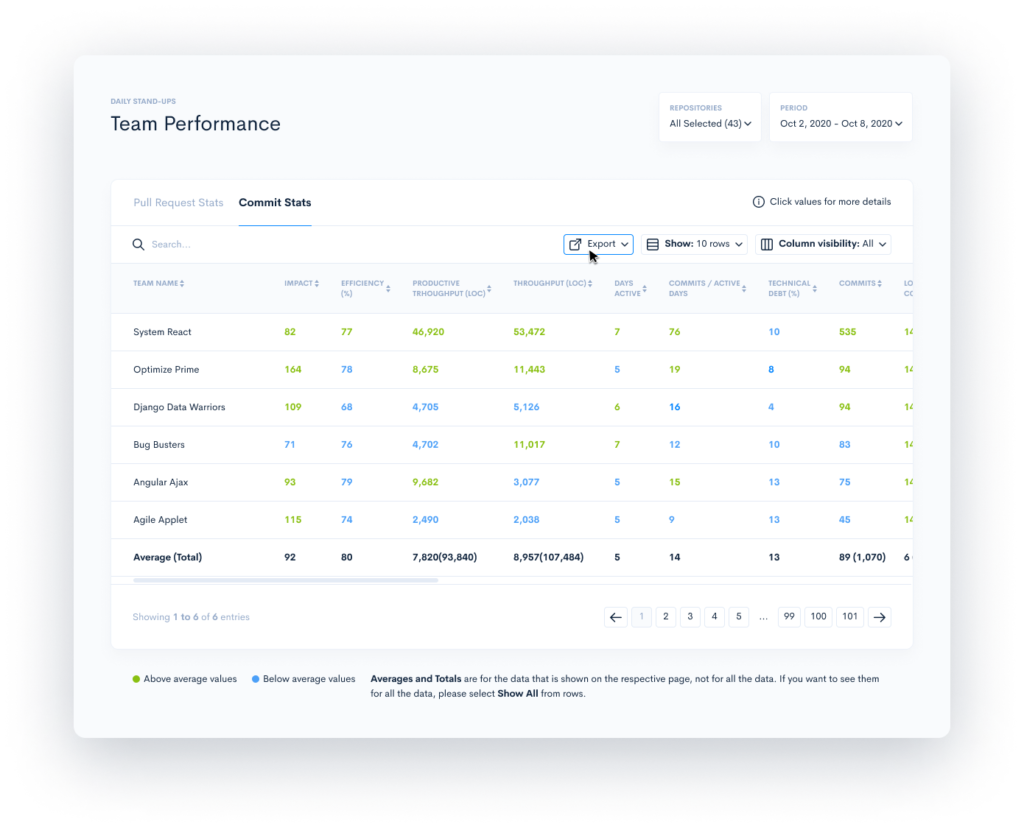
At Waydev, we know that analyzing deployments individually, using CI / CD tools, and creating reports based on the data is not a solution for engineering executives with busy agendas and a wide range of responsibilities.
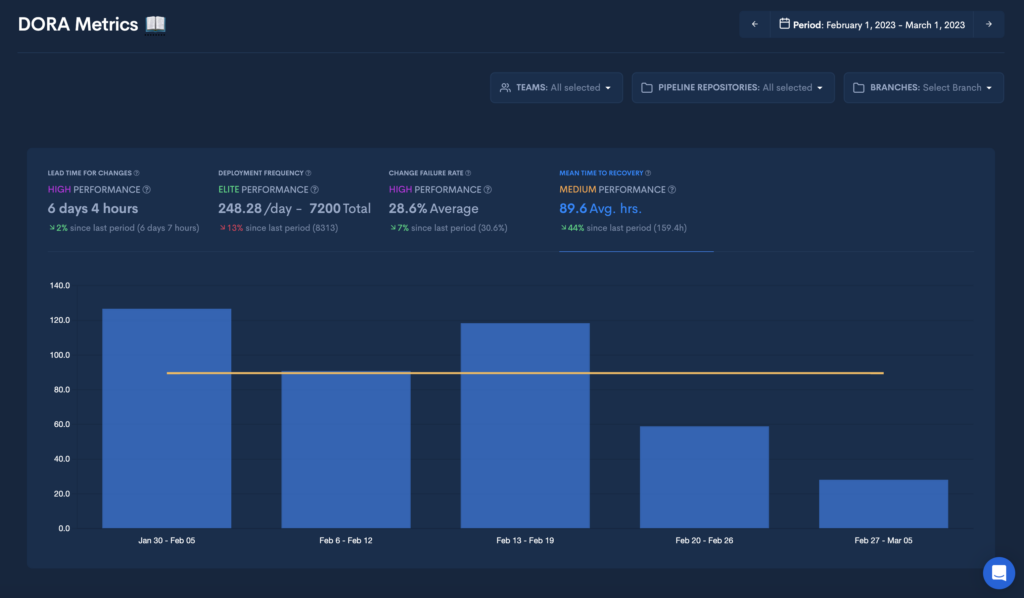
Waydev automatically pulls data from your CI / CD pipelines and aggregates your team’s DORA metrics to ensure the information you need is available in your dashboard, a few clicks away.
By accessing your Dora metrics dashboard, you get an excellent view of your team’s output and may assess DevOps performance.
Contact us for a demo, and we will show you how to master our solutions to drive software development and organizational performance.
😍 You May Also Like:
😍 Lead Time for Changes Vs Cycle Time 🔥
Ready to unlock your SDLC productivity?