Product update: AI Adoption 2.0
Six months ago, most engineering teams relied on one or two AI coding assistants. Today, companies commonly run three to four in parallel, GitHub Copilot, Cursor, Claude Code, and Windsurf, often on the same team, sometimes on the same pull request. Leaders need a unified way to see how they work together, not four disconnected vendor dashboards that never agree on a definition.
Waydev’s AI Adoption 2.0 brings that clarity. GitHub Copilot, Cursor, Claude Code, and Windsurf now sit on the same page, with a full breakdown of usage, impact, and delivery outcomes across every tool your teams actually use.
The fragmentation problem is not hypothetical. The 2025 DORA report, drawing on nearly 5,000 technology professionals, found that 90 percent of respondents now use AI in their daily work, up 14 points in a single year, and that higher AI adoption is associated with an increase in both delivery throughput and delivery instability at the same time.1 Teams are moving faster and, in the same breath, generating more risk, and a dashboard that only reports one AI tool cannot tell you which of your four assistants is driving which half of that trade-off.
For companies that moved from a single AI tool to three or four, a unified view removes the guesswork and shows exactly how each assistant contributes to the delivery pipeline, rather than forcing you to reconcile four separate vendor reports that were never built to be compared.
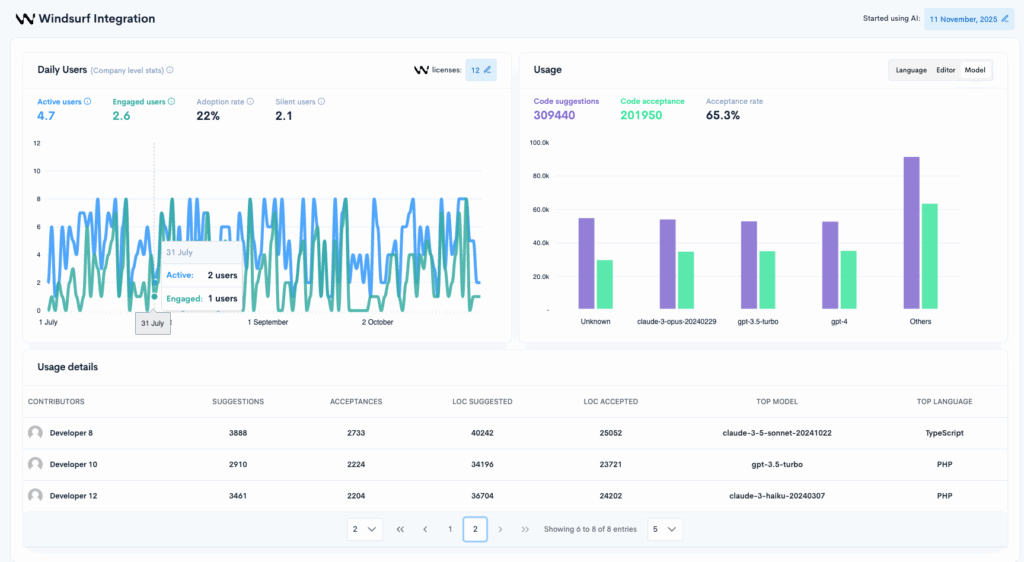
Select from a full breakdown of usage and impact across all AI assistants, broken out per tool rather than blended into a single AI-wide number.
How much of what each assistant proposes actually survives into a merged pull request, the clearest signal of whether a tool’s suggestions fit how your codebase actually works.
Which teams have picked up which tools, and how deep that adoption runs, not just how many seats were assigned.
The gap between a licensed seat and a developer who actually uses the tool day to day, which is usually where AI spend quietly leaks.
Where each assistant performs best across your actual stack, since a tool that excels in one language can lag noticeably in another.
How usage differs by contributor, not just by team, so enablement decisions target the people who need them rather than a whole org at once.
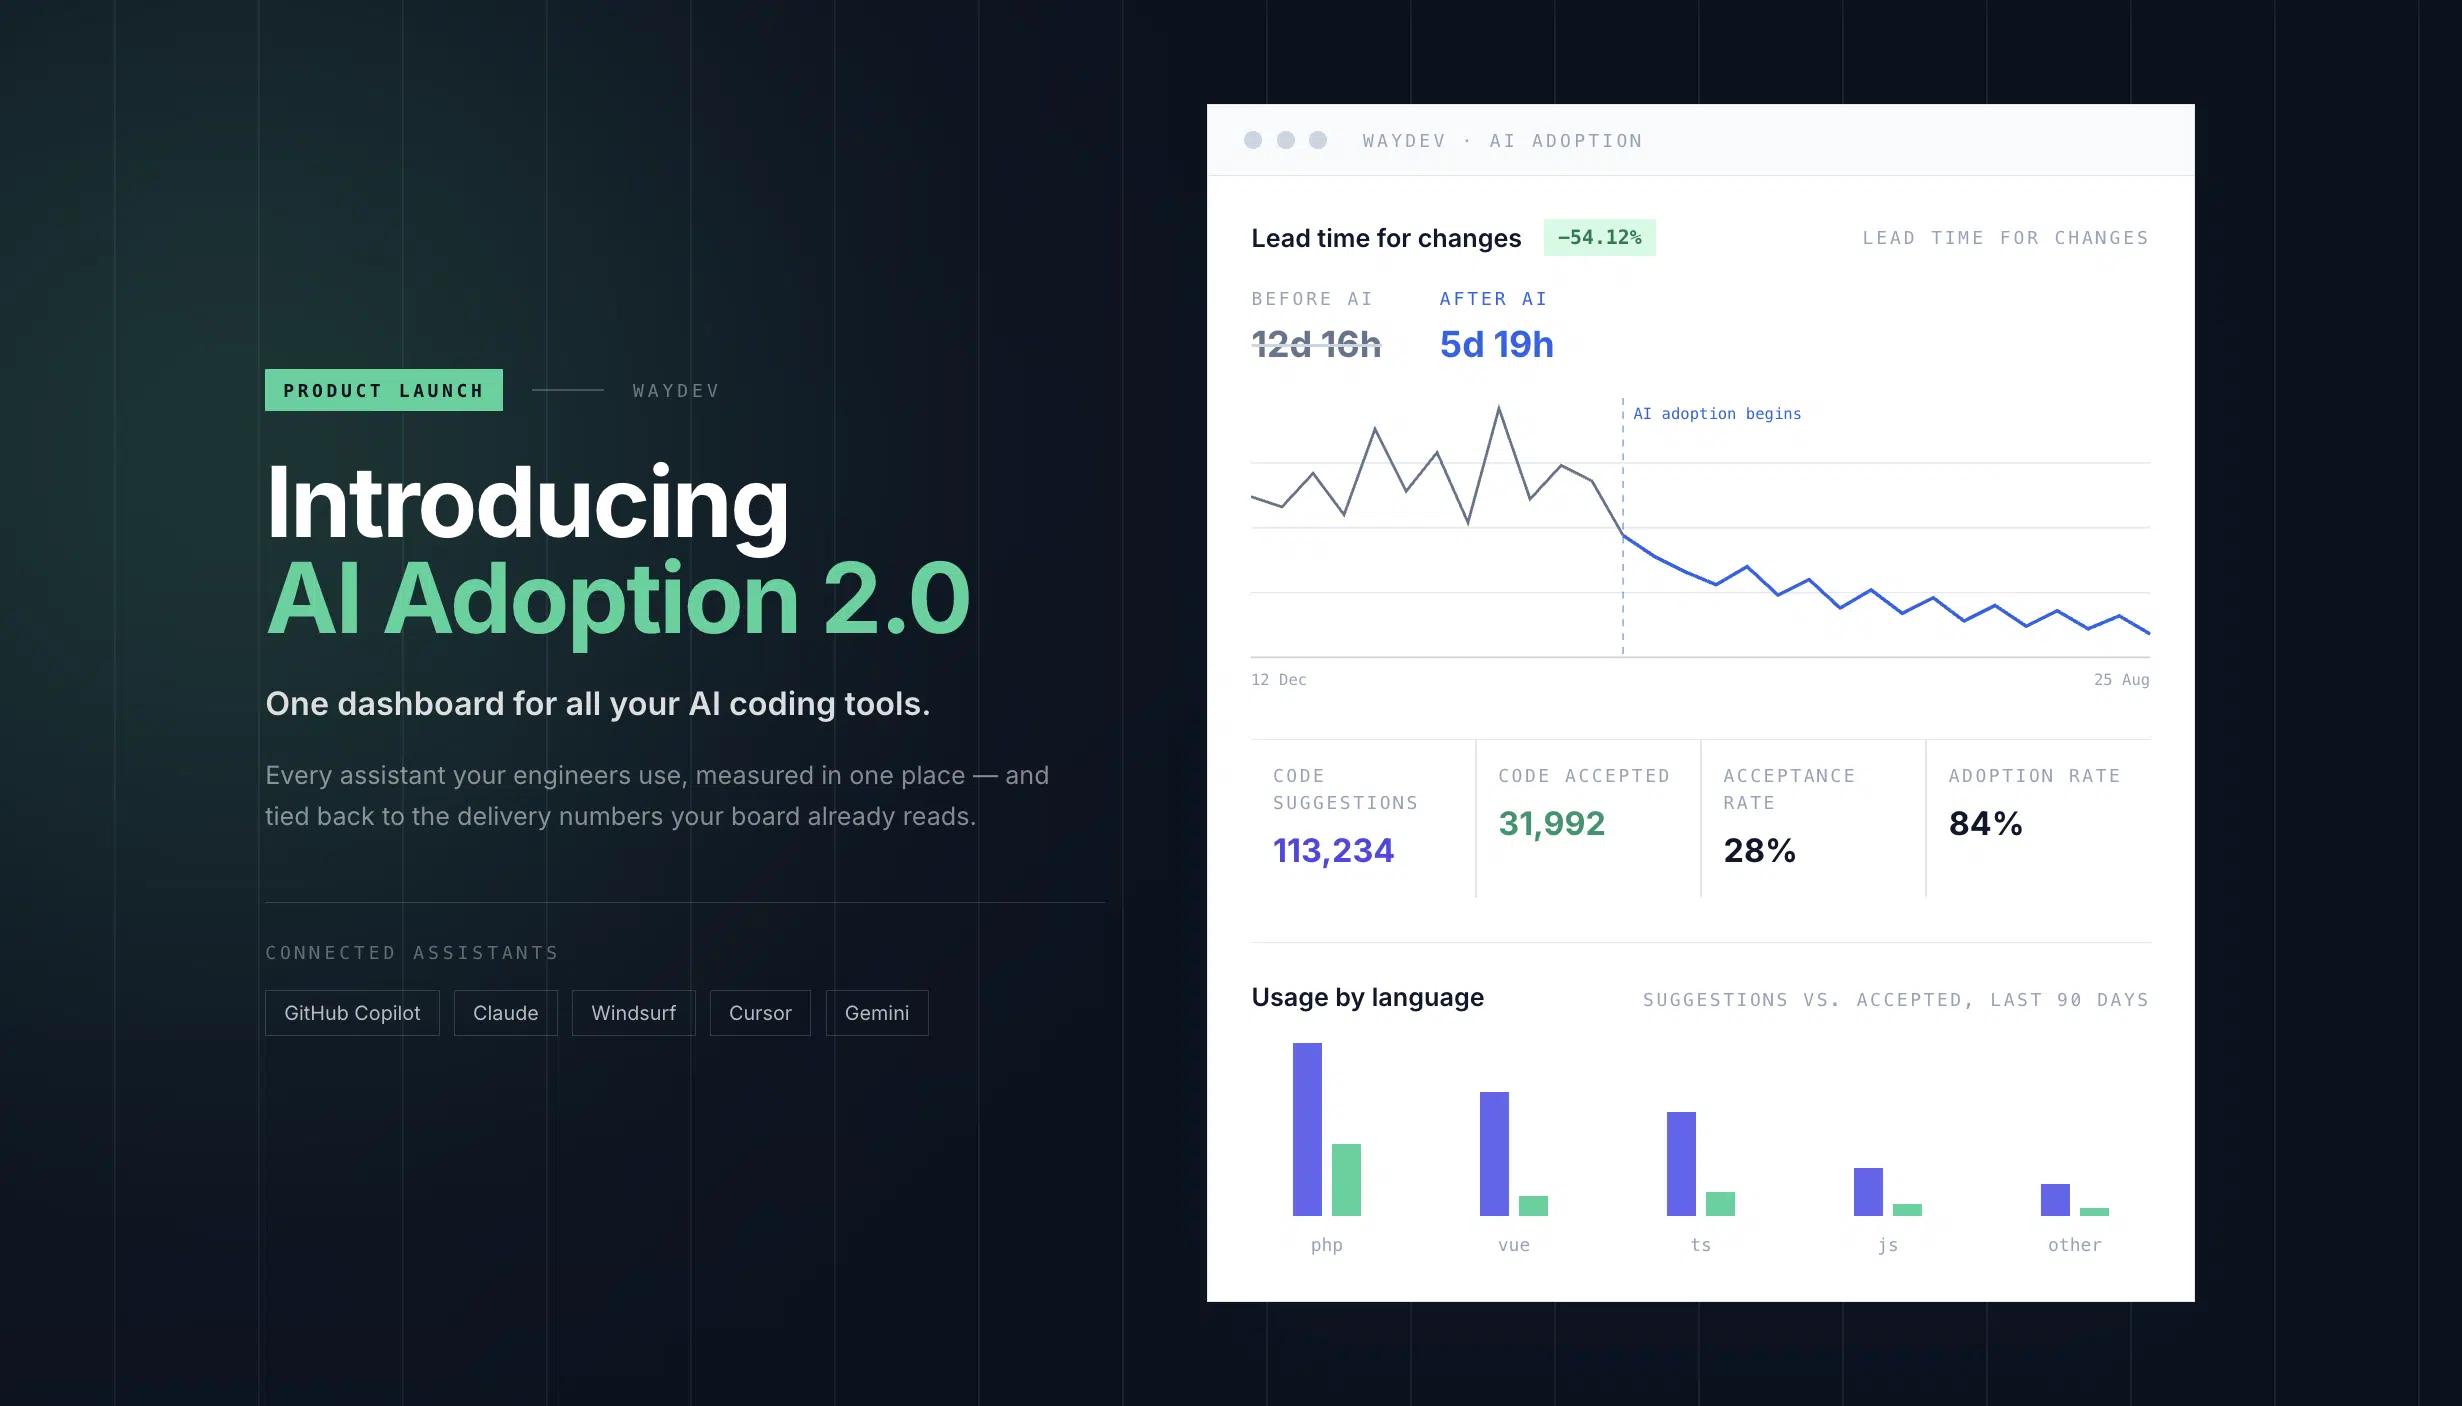
AI Adoption 2.0 tracks how performance metrics evolved before and after AI adoption, so a claim like “AI made us faster” becomes a number rather than an impression. It shows how AI changes lead time for changes, delivery speed and review cycles, deployment stability, code acceptance behavior, and cross-tool usage trends, all measured against your own baseline.
One organization’s measured result after AI adoption. Individual results vary by team, tool mix, and starting baseline.
| Signal | What changes |
|---|---|
| Lead time for changes | How long a change takes from first commit to production, tracked across the same DORA definition Waydev already uses elsewhere in the platform |
| Delivery speed and review cycles | Whether faster coding is actually reaching production, or getting absorbed by a slower review stage |
| Deployment stability | Whether shipping faster is coming at the cost of change failure rate, the DORA-era trade-off the 2025 report specifically flags1 |
| Code acceptance behavior | How often AI-suggested code survives review unchanged versus getting rewritten |
| Cross-tool usage trends | How the mix of tools in use shifts over time as teams settle on what actually works for them |
Scroll the table sideways to see every column.
As teams adopt three or four tools at once, individual behavior becomes the detail that actually explains the org-wide number. Waydev now shows who benefits most from each tool, how suggestions differ across Copilot, Cursor, Claude Code, and Windsurf, where AI accelerates work versus reduces toil versus quietly increases rework, and how usage correlates with outcomes and team impact.
This is the data that guides enablement, training, and AI investment decisions, replacing a debate about which tool “feels faster” with a number tied to your own delivery outcomes.
| Tool | Status |
|---|---|
| GitHub Copilot | Supported |
| Cursor | Supported |
| Claude Code | Supported |
| Windsurf | Supported |
Adoption used to be a single number. Now it’s a mix, and the mix is the story.
AI Adoption 2.0 gives companies the data they need to scale AI responsibly. Whether your team is experimenting with a single assistant or running four tools every day, Waydev provides full visibility into what works and helps you optimize your AI-driven development process, inside the same platform already reporting your delivery, health, and planning metrics rather than in a separate AI-only tool that never talks to the rest of your data.
AI Adoption sits alongside AI Impact and AI ROI as the three stages of the WAY Framework: adoption shows who is using what, impact shows what changed, and ROI puts a number on what it returned.
GitHub Copilot, Cursor, Claude Code, and Windsurf are natively supported in AI Adoption 2.0, on the same dashboard rather than as separate reports.
Per tool. Usage, acceptance, and delivery impact are broken out by assistant, so you can see that Copilot is driving one outcome while Cursor is driving another, instead of one average that hides both.
Alongside. AI Adoption 2.0 reads the same lead time, deployment stability, and delivery signals Waydev’s DORA metrics report already tracks, and compares them before and after AI adoption rather than introducing a separate metric system.
Reach out to your account team. Tool coverage in this category is moving quickly, and which assistants are natively supported can change between releases.
A seat dashboard tells you who has access. AI Adoption 2.0 tells you who is actually using it, how their output performs against delivery outcomes, and how that compares across every other tool on the same team, which a single-vendor dashboard cannot show by design.
Connect your repositories and see adoption, acceptance, and delivery impact across every AI assistant your teams are actually using.
Schedule a DemoOr explore the AI Adoption feature page first.
The lead time example above reflects one organization’s measured result and is illustrative, not a guaranteed outcome. Last updated September 2026.
Ready to unlock your SDLC productivity?











