Most engineering leaders can tell you how many AI licenses they bought. Very few can tell you whether those tools are actually changing delivery speed, code quality, or cost per feature. That gap is the problem. Building a real AI adoption assessment tool for enterprise engineering means moving past login counts and into the metrics that your CFO and board will actually care about.
Before you measure anything, you need a shared definition. Most organizations treat AI adoption as a binary: either a developer has access to a tool, or they don’t. That framing is too shallow to drive decisions.
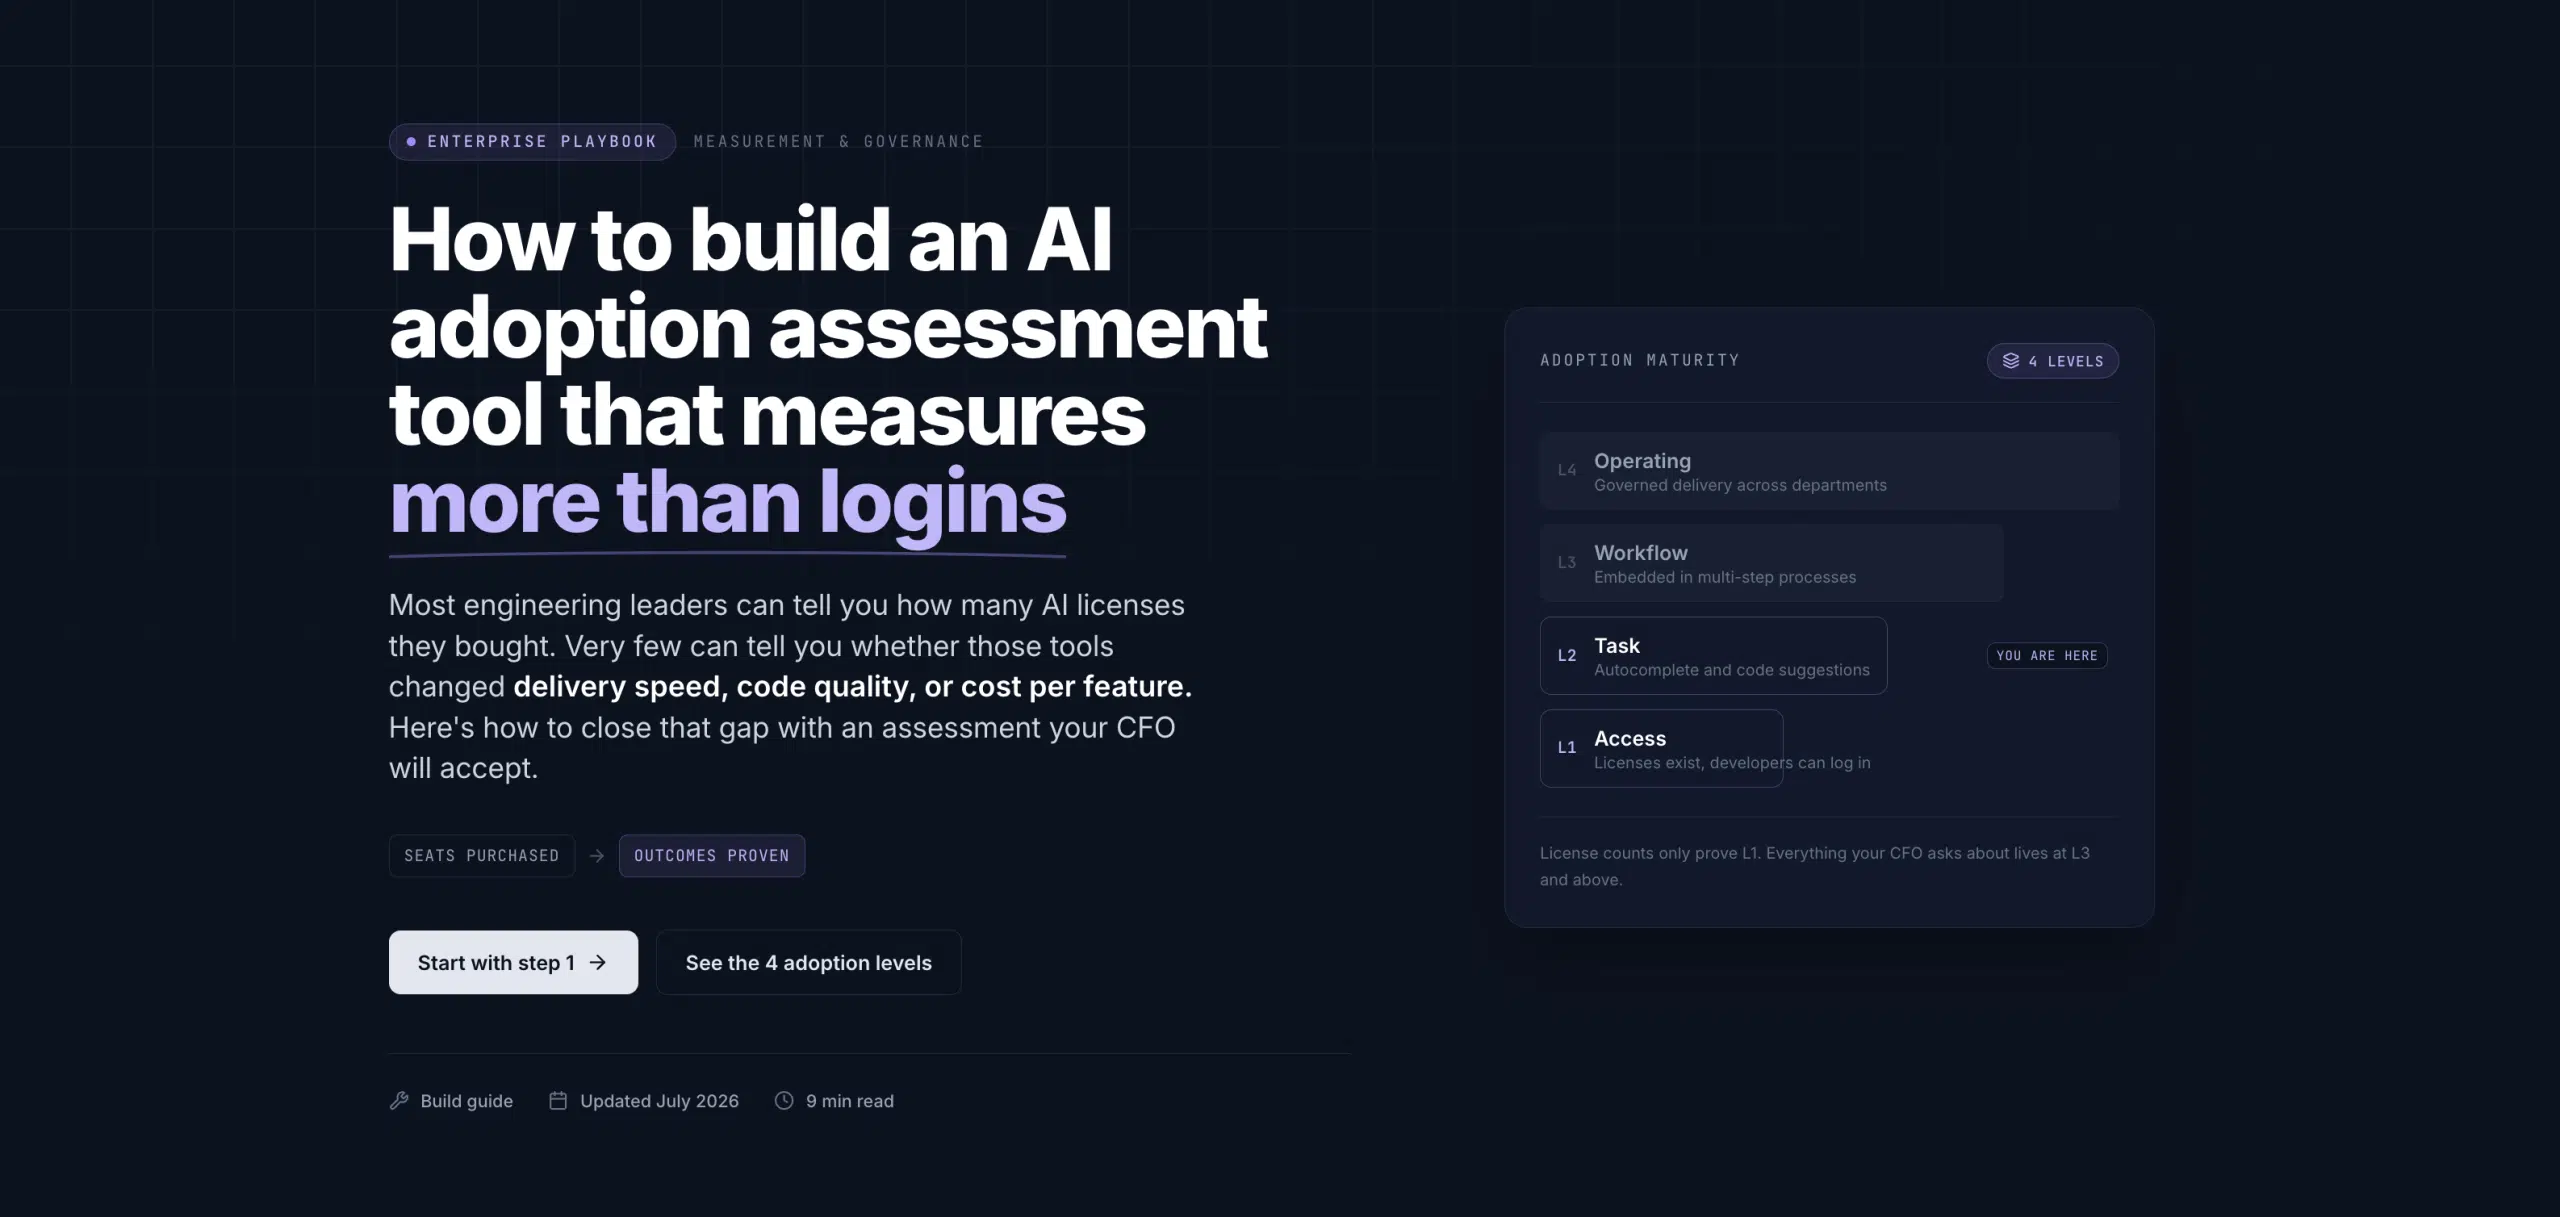
A more useful model breaks adoption into four levels:
Most large enterprises today sit between task and workflow adoption. The gap to operating adoption is where competitive advantage actually forms.
When you define adoption at the org level, you also need to decide which tools count. A typical enterprise AI stack in 2026 includes foundation model APIs, AI coding assistants like GitHub Copilot or Cursor, AI-enhanced features inside existing software, and internally built systems. An accurate adoption picture covers all of them, not just the one tool your procurement team formally approved.
The board-level framing matters too. of 1,973 managers, organizations that redesign work processes with AI are twice as likely to exceed revenue goals. That context helps justify building a rigorous assessment framework rather than relying on vendor-reported usage stats.
Start by writing a one-page definition document that names the adoption levels you’ll track, the tools in scope, and the business outcomes each level is expected to influence. Share it with your CPO, CFO, and at least two team-level engineering managers. If they disagree on what “adopted” means, you’ll know where the political work has to happen before the measurement work can.

By the end of this step, you should have a written definition that everyone from the CTO to a senior engineering manager would recognize as accurate. That document becomes the foundation for every measurement decision downstream.
With your definition in place, the next question is what data to collect. Not all signals are equally useful. The goal is signals that are both hard to game and directly tied to business outcomes.
There are three categories worth tracking at the org level.
These confirm that tools are actually being used, not just licensed. The key metrics here include weekly active users per tool, AI code suggestion acceptance rates, and the percentage of pull requests that contain AI-generated code. Usage signals tell you whether adoption is real or nominal.
These tell you whether AI is changing how fast software ships. Cycle time (time from first commit to deployment), PR review duration, and deployment frequency are the right anchors here. If cycle time doesn’t move after six months of AI tool rollout, that’s a signal worth investigating. Measuring AI’s impact on cycle time and deployment frequency is one of the fastest ways to show or disprove ROI.
These protect against the scenario where speed increases but reliability drops. Change failure rate and incident frequency on AI-touched code are the primary metrics. One operational finding worth noting: high AI adoption teams showed 9.5% of PRs as bug fixes versus 7.5% in low-adoption teams, which suggests quality trade-offs are possible if adoption isn’t managed carefully.
A usable approach is to run a signal audit before building anything. List every data source your org already produces: Git activity, CI/CD pipeline events, issue tracker data, and deployment logs. Map each signal to one of the three categories above. Most organizations discover they have 70% of the raw data they need. The missing 30% is usually AI-specific attribution: knowing which lines of code were written by an AI tool versus a human.
One important distinction: signals at the team or org level are what matter for an AI adoption assessment. Individual-level attribution data is useful for coaching, but ranking individual developers by AI usage creates surveillance dynamics that damage trust and slow adoption. Keep your signal design focused on team and org outputs.
By the end of this step, you should have a curated list of 6 to 9 signals spread across usage, delivery, and quality, each mapped to a specific data source you already have or can access through your toolchain.
At this point, you have a definition and a list of signals. Now you need a framework that turns those signals into a coherent picture of where your org stands and what to do next.
You have two real options: build a framework from scratch or select a platform that already has one. Building your own makes sense only if your engineering analytics infrastructure is already mature and your measurement needs are genuinely unique. For most enterprises, the faster path is to select a platform and configure it to your context.
An AI adoption assessment framework needs at least four components to produce actionable output. First, a baseline measurement layer that captures pre-AI performance so you have something to compare against. Second, a segmentation layer that breaks down adoption by team, tool, and workflow type. Third, an attribution layer that distinguishes AI-generated code from human contributions at the commit or PR level. Fourth, a predictive layer that shows where current trends are heading and what interventions would change those trajectories.
The attribution layer is where most legacy engineering analytics tools fall short. Without commit-level or diff-level AI attribution, you can see that cycle time improved, but you can’t prove AI caused it. That distinction is exactly what your CFO will ask about when you present ROI numbers.
A critical insight from the research across 11 enterprise AI analytics products: only 64% of tools on the market mention predictive capabilities at all, and none explicitly confirm a functioning predictive model. That gap is material. A framework that only describes what happened last quarter doesn’t help you decide what to invest in next quarter.
This is where we built Waydev’s AI Adoption feature set specifically to address. We track adoption across GitHub Copilot, Cursor, and Claude Code on a single pane, with before-and-after comparisons built directly into the interface. The Predict & Improve engine goes further: it simulates what process changes would move specific metrics, so you’re not just reading history, you’re planning forward.
If you’re building your own, structure it against maturity levels rather than a single score. A maturity model gives stakeholders a clear sense of where you are and what the next step looks like. Five levels work well: measuring access only, measuring usage, measuring delivery impact, measuring ROI, and running continuous improvement loops. Each level has entry criteria and exit criteria. That structure makes the assessment a living thing rather than a one-time audit.
A useful reference point: software engineering has used maturity models for decades to describe exactly this kind of progression from ad hoc processes to optimized, data-driven ones. An AI adoption maturity model follows the same logic.
By the end of this step, you should have either a documented framework specification or a selected platform that you’ve configured against your org’s definition and signals from steps one and two.
This is the step most organizations skip, and it’s the one that determines whether the board takes your AI investment seriously.
The connection between adoption data and business outcomes isn’t automatic. High acceptance rates on AI code suggestions don’t tell your CFO anything useful. What they need to see is cycle time reduced by X days, which translates to Y features shipped per quarter, which represents Z dollars of engineering capacity recovered or redirected.
Build a simple translation chain from signal to dollar value. Start with a delivery signal: cycle time. Multiply the time saved per developer per week by your average loaded developer cost. Then multiply by headcount and annualize. That number is the efficiency-side ROI. Do the same exercise for deployment frequency: more frequent deploys often correlate with faster time to market on revenue-generating features. If your product team can estimate the revenue value of a one-week faster release cycle, you can connect engineering velocity directly to the P&L.
Operational benchmarks exist to anchor these calculations. Developers using AI coding tools save an average of 2 to 3 hours per week, with heavier users saving more than 5 hours. Those are industry-level numbers; your actual results will vary based on implementation quality and adoption depth. The point is to use them as a starting range, then replace them with your own measured data as it accumulates.

The table below maps the most common adoption signals to their corresponding business outcome proxies. Use this as a starting point and adjust the outcome column based on how your finance team prefers to frame engineering value.
| Adoption Signal | What It Measures | Business Outcome Proxy | Who Cares |
|---|---|---|---|
| AI code acceptance rate | How often developers accept AI suggestions | Time saved per developer per week | CFO, Engineering VP |
| Cycle time delta (before vs. after AI) | Change in time from commit to deploy | Features shipped per quarter, time-to-market | Board, CPO |
| Change failure rate on AI-generated code | Reliability of AI-assisted code in production | Incident cost, SLA compliance risk | CTO, CISO |
| Token spend per team | Cost efficiency of AI tool usage | Cost per feature, AI budget burn rate | CFO, FinOps |
| Weekly active AI users / total licensed | Real vs. nominal adoption | License ROI, tool consolidation decisions | CTO, Procurement |
Waydev connects these dots natively. The platform tracks AI-generated code from commit to production, maps token spend per team and per tool, and surfaces cost per PR and cost per feature across every AI vendor in your stack. That means you can walk into a board meeting with a concrete figure — such as the cycle time improvement and cost efficiency your Cursor investment delivered — rather than a screenshot of an acceptance rate dashboard.
By the end of this step, you should have a written outcome model: a one-page document that shows which signals map to which financial proxies and who in the business owns each one. That document is what you’ll use to get buy-in from finance before you present the first round of assessment results.
With your framework and outcome model in place, it’s time to run the first actual assessment. The goal here is a clean baseline: a snapshot of where the org stands before any intervention, and a segmented view that shows variance across teams and tools.
Aggregate adoption numbers lie. An org-level AI adoption rate of 60% sounds healthy. But if three teams are at 90% and five teams are at 20%, the aggregate masks a serious problem. Always run the baseline with at least two segmentation cuts: by team and by tool.
The team segmentation shows you where adoption is strong (and why) versus where it’s lagging (and what’s blocking it). The tool segmentation shows you which AI vendors are actually being used versus which ones were purchased and abandoned. In most enterprises with multi-tool AI stacks, 30 to 40% of licensed tools have active usage rates below 15%. That’s budget leaking out the door.
Within each team, classify users into four groups based on observed behavior rather than self-reported habits. Active users engage with AI tools on most working days. Engaged users use tools regularly but not daily. Silent users have access but show minimal or no usage signals. Non-adopters have licenses but no usage at all.
This segmentation, which Waydev surfaces in the AI Adoption 2.0 feature, gives you a concrete action list. Active users are candidates for deeper workflow integration. Silent and non-adopters need either different tooling, different training, or a conversation about whether the tool fits their actual work pattern.
A useful baseline covers 60 to 90 days of historical data before the formal assessment date. It should include: active user rates by team and tool, acceptance rates for AI suggestions, cycle time averages pre-AI (using Git history going back further), and token spend if you’re tracking AI API consumption.
One usable note on data collection: if your AI tools have been deployed for less than 11 weeks, your baseline numbers will be noisy. Developers typically need a sustained period of consistent AI tool use before productivity gains stabilize. Starting the formal assessment too early produces misleading data that can undermine the entire program.
Once you have clean baseline data across teams and tools, you can prioritize which teams to focus on first in your improvement program. The highest-value intervention targets are usually teams with high license coverage but low active usage, because the friction there is behavioral or workflow-level, not a tool access problem. Those are fast wins.
A one-time assessment is a report. A continuous assessment loop is a management system. The difference is whether your framework generates interventions and tracks whether those interventions worked.
Quarterly reviews are the right cadence for board-level AI adoption reporting. But the improvement loop needs to run faster. Weekly or bi-weekly check-ins at the team level, using the same signals you established in step two, let engineering managers catch regressions before they compound. Think of it like a deployment pipeline: you wouldn’t wait 90 days to find out a release broke something.
Waydev’s AI Checkpoints feature is built for exactly this cadence. Checkpoints let you set delivery targets at specific points in the development cycle and flag when AI-assisted work is tracking off from expected outcomes. That’s the difference between a dashboard you check occasionally and a system that surfaces problems before they affect a sprint commitment.
Each signal in your framework should have a corresponding intervention playbook. If AI code acceptance rates drop by more than 15% in a team over two weeks, the playbook triggers a manager conversation about whether the tool is being used on appropriate tasks. If cycle time increases despite high AI adoption, the playbook triggers an investigation into review bottlenecks, because AI-generated code that requires more review time than human-written code is a net negative.
The goal is to make your assessment framework self-correcting. The data surfaces the problem; the playbook names the response; the next assessment cycle measures whether the response worked. That’s a continuous improvement loop in the engineering intelligence sense of the term.
For the board and CFO, AI adoption data should translate into three numbers: current ROI on AI spend, trajectory (is it improving or stagnating), and risk (are there teams or tools where quality signals are trending the wrong way). Waydev’s Ask Waydev capability lets engineering leaders pull natural-language answers from their engineering data, which means you can prepare board-level summaries without spending three days wrangling spreadsheets.
The Predict & Improve engine matters here too. Rather than showing the board a snapshot of the past quarter, you can show a projection: if current adoption trends continue, here’s what cycle time and deployment frequency will look like in 90 days. If we increase active AI adoption in the four underperforming teams, here’s the estimated impact on delivery capacity. That forward-looking framing is what turns AI adoption from a tech initiative into a business management topic.
The companies trusted with Waydev’s platform, including American Express, Dropbox, and PwC, use this kind of structured reporting to make AI spend a board-level metric rather than an IT line item. The org-level view, with clear before-and-after comparisons and predictive guidance, is what makes the difference between a conversation about tools and a conversation about outcomes.
Engineering leaders who find this level of data governance useful in AI investment contexts often face similar challenges in other operational areas. The discipline of SaaS analytics tooling for revenue and retention follows a similar pattern: measurement first, then segmentation, then continuous improvement loops tied to business outcomes. The underlying management framework is the same even when the domain differs.
By the end of this step, your framework runs on a defined cadence, produces interventions not just reports, and gives you a clear narrative for board-level conversations about the return on your AI investment.
An AI adoption assessment tool for enterprise is a platform or framework that measures how deeply AI tools are embedded in engineering workflows, tracks their impact on delivery performance and code quality, and connects that data to business outcomes like ROI and deployment speed. It goes beyond license usage counts to show whether AI is actually changing how software gets built.
Measuring AI ROI in engineering starts with a before-and-after comparison of key delivery signals: cycle time, deployment frequency, and change failure rate. You then translate time savings into financial value using loaded developer cost rates. Platforms like Waydev automate this by tracking AI-generated code at the commit level and mapping token spend to engineering output, giving you cost-per-PR and cost-per-feature numbers that finance teams can work with.
Track signals across three categories. For usage: weekly active users per tool, AI suggestion acceptance rates, and the share of PRs containing AI-generated code. For delivery: cycle time delta before and after AI adoption, and deployment frequency. For quality: change failure rate and incident frequency on AI-assisted code. Six to nine signals across these categories give you a complete picture without creating noise.
Traditional DORA dashboards report aggregate delivery metrics but can’t separate AI-generated code from human contributions. Waydev tracks AI code at the commit and PR level, measures token spend per team and per tool, and includes a Predict & Improve engine that projects where current trends are heading. That attribution layer is what makes ROI calculation credible rather than estimated.
Plan for 11 to 12 weeks before your adoption data stabilizes. Developers typically need several weeks of consistent AI tool use before productivity gains become measurable and consistent. Starting your baseline assessment before that window closes will produce noisy numbers. Use the first 11 weeks for data collection and framework configuration, then run your first formal assessment after that.
The biggest mistake is measuring access instead of outcomes. Reporting that 70% of engineers have Copilot licenses tells you nothing about whether those licenses are changing delivery speed, code quality, or cost. An enterprise AI adoption assessment needs to connect usage signals to delivery signals to business outcomes, with attribution data that can separate AI-driven improvements from other process changes.
Building a real AI adoption assessment framework takes six steps: define what adoption means at the org level, choose signals that matter to the business, build or select a framework with attribution and prediction capabilities, connect your data to financial outcomes, run a segmented baseline, and then close the loop with continuous improvement cadences. If you want to skip the build-it-yourself path, Waydev gives you all six layers out of the box. The best next step is to pull your own historical Git data and see what a before-and-after comparison on cycle time actually shows for your org.
Ready to unlock your SDLC productivity?