
Your engineering work already leaves a complete record. Every commit, branch, pull request, review comment and merge is timestamped and attributed in GitHub, GitLab, Bitbucket or Azure DevOps. Waydev reads that record and turns it into delivery metrics your leadership can act on, without asking a single engineer to fill in a form.
This page covers what Git analytics actually gives you, what it reads from each provider, what it cannot tell you on its own, and why the Git record matters more in 2026 than it did when most teams first started measuring it.
Most engineering reporting is assembled by hand. Someone updates a ticket, someone else writes a status summary, and by the time it reaches a leadership meeting it has passed through several rounds of interpretation. The Git history has none of that. It is a byproduct of the work itself, which means it is neither optimistic nor defensive.
That gives you three things a status report cannot:
Visibility without interruption
You walk into a planning or board meeting already knowing where work is flowing and where it is stuck, without anyone spending an afternoon assembling slides. The data collects itself.
Bottlenecks located precisely
Slow delivery is rarely slow coding. Break cycle time into coding, review, and deployment stages and the delay usually turns out to be waiting for review, not writing the change. That is a process problem with a process fix.
Comparison over time that holds up
Compare this quarter to last on the same definitions, and benchmark teams against the rest of your own organization. Trend lines survive scrutiny in a way that a single snapshot never does.
One thing this data is not for: ranking individual engineers. Commit counts and lines changed measure activity, not contribution, and teams that get measured that way learn to produce activity. Waydev is built to improve systems and unblock teams. That is also what the research behind DORA and SPACE consistently supports.
| Integration | Deployment | What it feeds |
|---|---|---|
| GitHub Analytics | Cloud | Commits, branches, PRs, reviews, merges. Full delivery and code review reporting. |
| GitHub Enterprise | Self-hosted | Same reporting for organizations that keep their Git server inside their own network. |
| GitLab Analytics | Cloud | Merge request activity, review participation, pipeline-linked delivery metrics. |
| GitLab Enterprise | Self-hosted | Self-managed GitLab, including air-gapped and regulated environments. |
| Bitbucket Analytics | Cloud | Codebase analysis, PR and review workflow metrics, delivery reporting. |
| Bitbucket Server | Self-hosted | On-premise Bitbucket, connected without moving your source code anywhere. |
| Azure DevOps Analytics | Cloud and server | Repos and pull requests plus work item context from the same platform. |
| Jira | Cloud and server | Sprint risk, planned against completed work, and the link between tickets and code. |
| Slack | Cloud | Alerts when a team hits a target, drops below a threshold, or triggers an event. |
See the full list on the integrations page. Most organizations run more than one provider, and Waydev reports across all of them in a single view.
Connect your organization and Waydev analyzes the codebase automatically: commit and branch history, pull request lifecycles, review participation and merge outcomes. From that you get DORA metrics, pull request insights, and merge quality including how thoroughly changes are actually reviewed rather than just approved. Teams running GitHub Enterprise get identical reporting through the GitHub Enterprise integration.
Waydev converts GitLab merge request and commit activity into actionable metrics without manual updates or developer interruption. Merge request review time is usually the first place a GitLab organization finds real recoverable delay, and it is visible in cycle time broken down by stage. Self-managed instances connect through the GitLab Enterprise integration, which matters for the regulated environments where GitLab self-hosted is most common.
Waydev analyzes your Bitbucket codebase to surface where velocity is being lost and where review load is concentrated on too few people. Because most Bitbucket organizations also run Jira, connecting both gives you the ticket-to-code link that makes velocity and sprint commitment reporting meaningful. On-premise teams use the Bitbucket Server integration.
Connect your Azure DevOps account, select the relevant repositories, and Waydev processes the history. Because repos, pull requests and work items live in one platform, Azure DevOps organizations get the tightest coupling between planned work and delivered code of any provider, which makes resource allocation and project cost reporting straightforward. Details on the Azure DevOps integration page.
| Area | Reports | The question it answers |
|---|---|---|
| Delivery | DORA, Cycle Time, PR Insights, Merge Quality | How fast does work reach production, and does it stay up when it gets there? |
| Health | Insights, Benchmark, Hygiene, Developer Experience | Where is the process breaking down, and what is getting in your engineers’ way? |
| Planning | Bird’s-Eye View, Resource Planning, Cost Capitalization | Where is engineering effort going, what does it cost, and what can be capitalized? |
| AI | AI Adoption, AI Impact, AI ROI, Waydev Agent | Are the AI tools being used, did delivery actually change, and did it pay back? |
| Studio | Custom Dashboards, Custom Metrics, Targets, Notifications | Can I build the exact view my organization needs rather than the one shipped by default? |
When AI coding assistants arrived, a reasonable prediction was that Git data would matter less. The opposite happened. Vendor dashboards tell you how many suggestions were accepted inside their own tool. Only the Git record tells you what happened to that code afterwards: whether it passed review quickly, whether it was reworked a week later, whether change failure rate moved.
That is why we keep adoption, impact and ROI as three separate measurements across Copilot, Cursor, Claude Code and Codex, rather than collapsing them into one score. Adoption comes from the tools. Impact and ROI come from your Git and ticketing history, which is the only place the evidence actually exists. There is more on the reasoning in DORA metrics in the AI era and in cost per accepted change.
One timing note worth acting on. A before-and-after comparison needs a before. If your AI rollout is underway and nobody connected the Git history first, that baseline is being overwritten right now and no vendor can reconstruct it later.
Being straight about the limits is what makes the rest credible. The Git record shows what happened, not how it felt or why. It will not tell you that a team is burning out, that the build environment is miserable to work in, or that a senior engineer is quietly carrying three projects. For that you need to ask, which is what Developer Experience surveys are for, and why the WAY Framework combines DORA, SPACE and Core 4 rather than betting everything on system data alone.
It also will not tell you whether the right thing was built. That is a product question, and no engineering metric answers it.
Step 1
Connect your provider
Authorize GitHub, GitLab, Bitbucket or Azure DevOps, or their self-hosted counterparts. Read access only. Your source code is not copied out of your environment.
Step 2
Select repositories and let the history backfill
Pick the repositories that matter. Waydev processes historical data, so you have trends on day one instead of waiting a quarter to accumulate them. Add Jira to link tickets to code and Slack for alerts.
Step 3
Decide what you are trying to improve
Pick one or two outcomes rather than watching everything. Set targets, and pull the data into your own systems through the Waydev API if you want it in a warehouse or developer portal.
Does Waydev work if we use more than one Git provider?
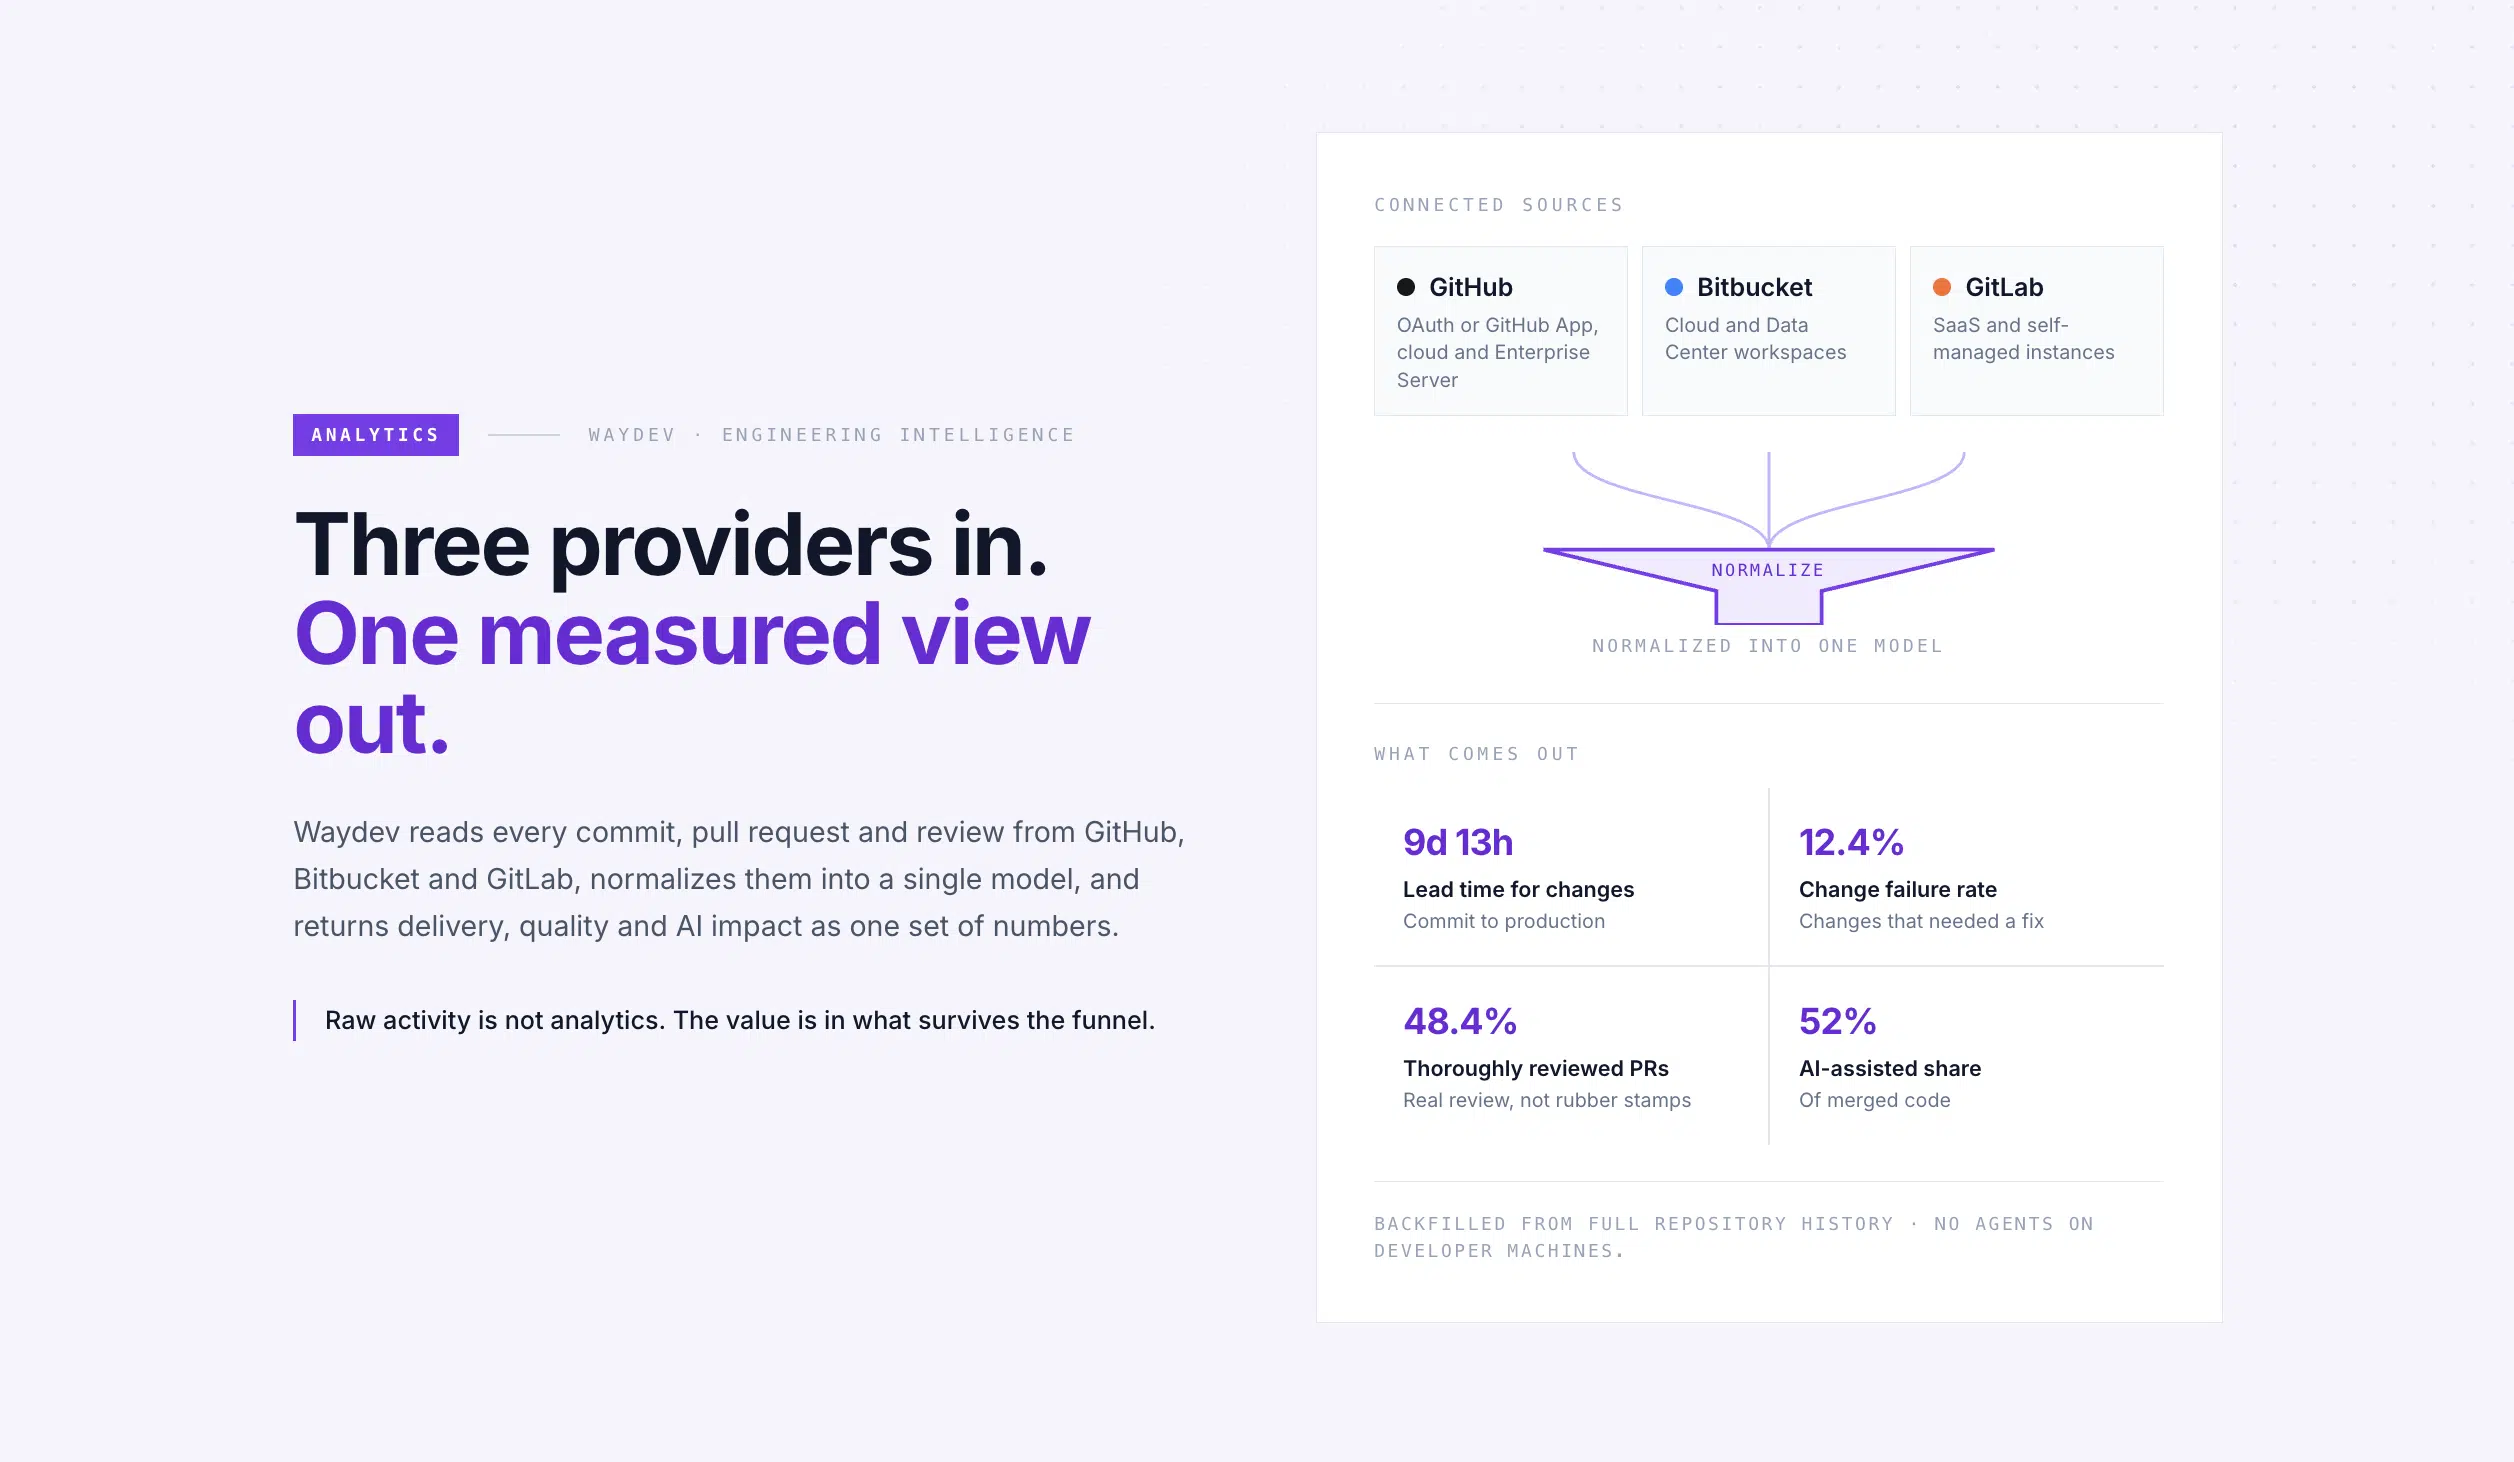
Yes, and most enterprises do. GitHub in one business unit, Azure DevOps in another and a legacy Bitbucket Server somewhere is a normal picture after a few acquisitions. Waydev normalizes across all of them into one view.
Does Waydev read our source code?
We analyze metadata and change patterns rather than shipping your intellectual property anywhere. For organizations that need the data to stay entirely inside their perimeter, the Enterprise plan supports on-premise and self-hosted deployment. Full detail on the security page.
How much history do we get?
Six months on Pro and thirty-six months on Premium, with more available on Enterprise. See pricing. Longer history matters most if you are trying to establish a pre-AI baseline.
Do engineers have to change how they work?
No. There is no timesheet, no plugin in the editor and no manual input. The data is a byproduct of work they are already doing, which is the entire point.
The short version
Your Git history already contains the answer to most questions your leadership asks about engineering. Waydev reads it across GitHub, GitLab, Bitbucket and Azure DevOps, cloud or on-premise, and turns it into metrics you can defend in a board meeting.
See your own data
Connect your repositories and we will backfill your history so you are looking at your own delivery numbers, not a demo tenant. You keep the analysis either way.
Integrations: GitHub · GitHub Enterprise · GitLab · GitLab Enterprise · Bitbucket · Bitbucket Server · Azure DevOps · Jira · Slack · All integrations
Further reading: The WAY Framework · DORA metrics · Cycle Time Playbook · DORA Metrics Playbook · SPACE Framework Playbook · Measuring AI ROI in engineering · Engineering Leaders Handbook
For: Executives · Engineering Managers · Product Leaders · Contributors
Your engineering work already leaves a complete record. Every commit, branch, pull request, review comment and merge is timestamped and attributed in GitHub, GitLab, Bitbucket or Azure DevOps. Waydev reads that record and turns it into delivery metrics your leadership can act on, without asking a single engineer to fill in a form.
This page covers what Git analytics actually gives you, what it reads from each provider, what it cannot tell you on its own, and why the Git record matters more in 2026 than it did when most teams first started measuring it.
Most engineering reporting is assembled by hand. Someone updates a ticket, someone else writes a status summary, and by the time it reaches a leadership meeting it has passed through several rounds of interpretation. The Git history has none of that. It is a byproduct of the work itself, which means it is neither optimistic nor defensive.
That gives you three things a status report cannot:
Visibility without interruption
You walk into a planning or board meeting already knowing where work is flowing and where it is stuck, without anyone spending an afternoon assembling slides. The data collects itself.
Bottlenecks located precisely
Slow delivery is rarely slow coding. Break cycle time into coding, review, and deployment stages and the delay usually turns out to be waiting for review, not writing the change. That is a process problem with a process fix.
Comparison over time that holds up
Compare this quarter to last on the same definitions, and benchmark teams against the rest of your own organization. Trend lines survive scrutiny in a way that a single snapshot never does.
One thing this data is not for: ranking individual engineers. Commit counts and lines changed measure activity, not contribution, and teams that get measured that way learn to produce activity. Waydev is built to improve systems and unblock teams. That is also what the research behind DORA and SPACE consistently supports.
| Integration | Deployment | What it feeds |
|---|---|---|
| GitHub Analytics | Cloud | Commits, branches, PRs, reviews, merges. Full delivery and code review reporting. |
| GitHub Enterprise | Self-hosted | Same reporting for organizations that keep their Git server inside their own network. |
| GitLab Analytics | Cloud | Merge request activity, review participation, pipeline-linked delivery metrics. |
| GitLab Enterprise | Self-hosted | Self-managed GitLab, including air-gapped and regulated environments. |
| Bitbucket Analytics | Cloud | Codebase analysis, PR and review workflow metrics, delivery reporting. |
| Bitbucket Server | Self-hosted | On-premise Bitbucket, connected without moving your source code anywhere. |
| Azure DevOps Analytics | Cloud and server | Repos and pull requests plus work item context from the same platform. |
| Jira | Cloud and server | Sprint risk, planned against completed work, and the link between tickets and code. |
| Slack | Cloud | Alerts when a team hits a target, drops below a threshold, or triggers an event. |
See the full list on the integrations page. Most organizations run more than one provider, and Waydev reports across all of them in a single view.
Connect your organization and Waydev analyzes the codebase automatically: commit and branch history, pull request lifecycles, review participation and merge outcomes. From that you get DORA metrics, pull request insights, and merge quality including how thoroughly changes are actually reviewed rather than just approved. Teams running GitHub Enterprise get identical reporting through the GitHub Enterprise integration.
Waydev converts GitLab merge request and commit activity into actionable metrics without manual updates or developer interruption. Merge request review time is usually the first place a GitLab organization finds real recoverable delay, and it is visible in cycle time broken down by stage. Self-managed instances connect through the GitLab Enterprise integration, which matters for the regulated environments where GitLab self-hosted is most common.
Waydev analyzes your Bitbucket codebase to surface where velocity is being lost and where review load is concentrated on too few people. Because most Bitbucket organizations also run Jira, connecting both gives you the ticket-to-code link that makes velocity and sprint commitment reporting meaningful. On-premise teams use the Bitbucket Server integration.
Connect your Azure DevOps account, select the relevant repositories, and Waydev processes the history. Because repos, pull requests and work items live in one platform, Azure DevOps organizations get the tightest coupling between planned work and delivered code of any provider, which makes resource allocation and project cost reporting straightforward. Details on the Azure DevOps integration page.
| Area | Reports | The question it answers |
|---|---|---|
| Delivery | DORA, Cycle Time, PR Insights, Merge Quality | How fast does work reach production, and does it stay up when it gets there? |
| Health | Insights, Benchmark, Hygiene, Developer Experience | Where is the process breaking down, and what is getting in your engineers’ way? |
| Planning | Bird’s-Eye View, Resource Planning, Cost Capitalization | Where is engineering effort going, what does it cost, and what can be capitalized? |
| AI | AI Adoption, AI Impact, AI ROI, Waydev Agent | Are the AI tools being used, did delivery actually change, and did it pay back? |
| Studio | Custom Dashboards, Custom Metrics, Targets, Notifications | Can I build the exact view my organization needs rather than the one shipped by default? |
When AI coding assistants arrived, a reasonable prediction was that Git data would matter less. The opposite happened. Vendor dashboards tell you how many suggestions were accepted inside their own tool. Only the Git record tells you what happened to that code afterwards: whether it passed review quickly, whether it was reworked a week later, whether change failure rate moved.
That is why we keep adoption, impact and ROI as three separate measurements across Copilot, Cursor, Claude Code and Codex, rather than collapsing them into one score. Adoption comes from the tools. Impact and ROI come from your Git and ticketing history, which is the only place the evidence actually exists. There is more on the reasoning in DORA metrics in the AI era and in cost per accepted change.
One timing note worth acting on. A before-and-after comparison needs a before. If your AI rollout is underway and nobody connected the Git history first, that baseline is being overwritten right now and no vendor can reconstruct it later.
Being straight about the limits is what makes the rest credible. The Git record shows what happened, not how it felt or why. It will not tell you that a team is burning out, that the build environment is miserable to work in, or that a senior engineer is quietly carrying three projects. For that you need to ask, which is what Developer Experience surveys are for, and why the WAY Framework combines DORA, SPACE and Core 4 rather than betting everything on system data alone.
It also will not tell you whether the right thing was built. That is a product question, and no engineering metric answers it.
Step 1
Connect your provider
Authorize GitHub, GitLab, Bitbucket or Azure DevOps, or their self-hosted counterparts. Read access only. Your source code is not copied out of your environment.
Step 2
Select repositories and let the history backfill
Pick the repositories that matter. Waydev processes historical data, so you have trends on day one instead of waiting a quarter to accumulate them. Add Jira to link tickets to code and Slack for alerts.
Step 3
Decide what you are trying to improve
Pick one or two outcomes rather than watching everything. Set targets, and pull the data into your own systems through the Waydev API if you want it in a warehouse or developer portal.
Does Waydev work if we use more than one Git provider?
Yes, and most enterprises do. GitHub in one business unit, Azure DevOps in another and a legacy Bitbucket Server somewhere is a normal picture after a few acquisitions. Waydev normalizes across all of them into one view.
Does Waydev read our source code?
We analyze metadata and change patterns rather than shipping your intellectual property anywhere. For organizations that need the data to stay entirely inside their perimeter, the Enterprise plan supports on-premise and self-hosted deployment. Full detail on the security page.
How much history do we get?
Six months on Pro and thirty-six months on Premium, with more available on Enterprise. See pricing. Longer history matters most if you are trying to establish a pre-AI baseline.
Do engineers have to change how they work?
No. There is no timesheet, no plugin in the editor and no manual input. The data is a byproduct of work they are already doing, which is the entire point.
The short version
Your Git history already contains the answer to most questions your leadership asks about engineering. Waydev reads it across GitHub, GitLab, Bitbucket and Azure DevOps, cloud or on-premise, and turns it into metrics you can defend in a board meeting.
See your own data
Connect your repositories and we will backfill your history so you are looking at your own delivery numbers, not a demo tenant. You keep the analysis either way.
Integrations: GitHub · GitHub Enterprise · GitLab · GitLab Enterprise · Bitbucket · Bitbucket Server · Azure DevOps · Jira · Slack · All integrations
Further reading: The WAY Framework · DORA metrics · Cycle Time Playbook · DORA Metrics Playbook · SPACE Framework Playbook · Measuring AI ROI in engineering · Engineering Leaders Handbook
For: Executives · Engineering Managers · Product Leaders · Contributors
Ready to unlock your SDLC productivity?