For
Gain insights into team performance to drive strategic decisions and maximize impact.
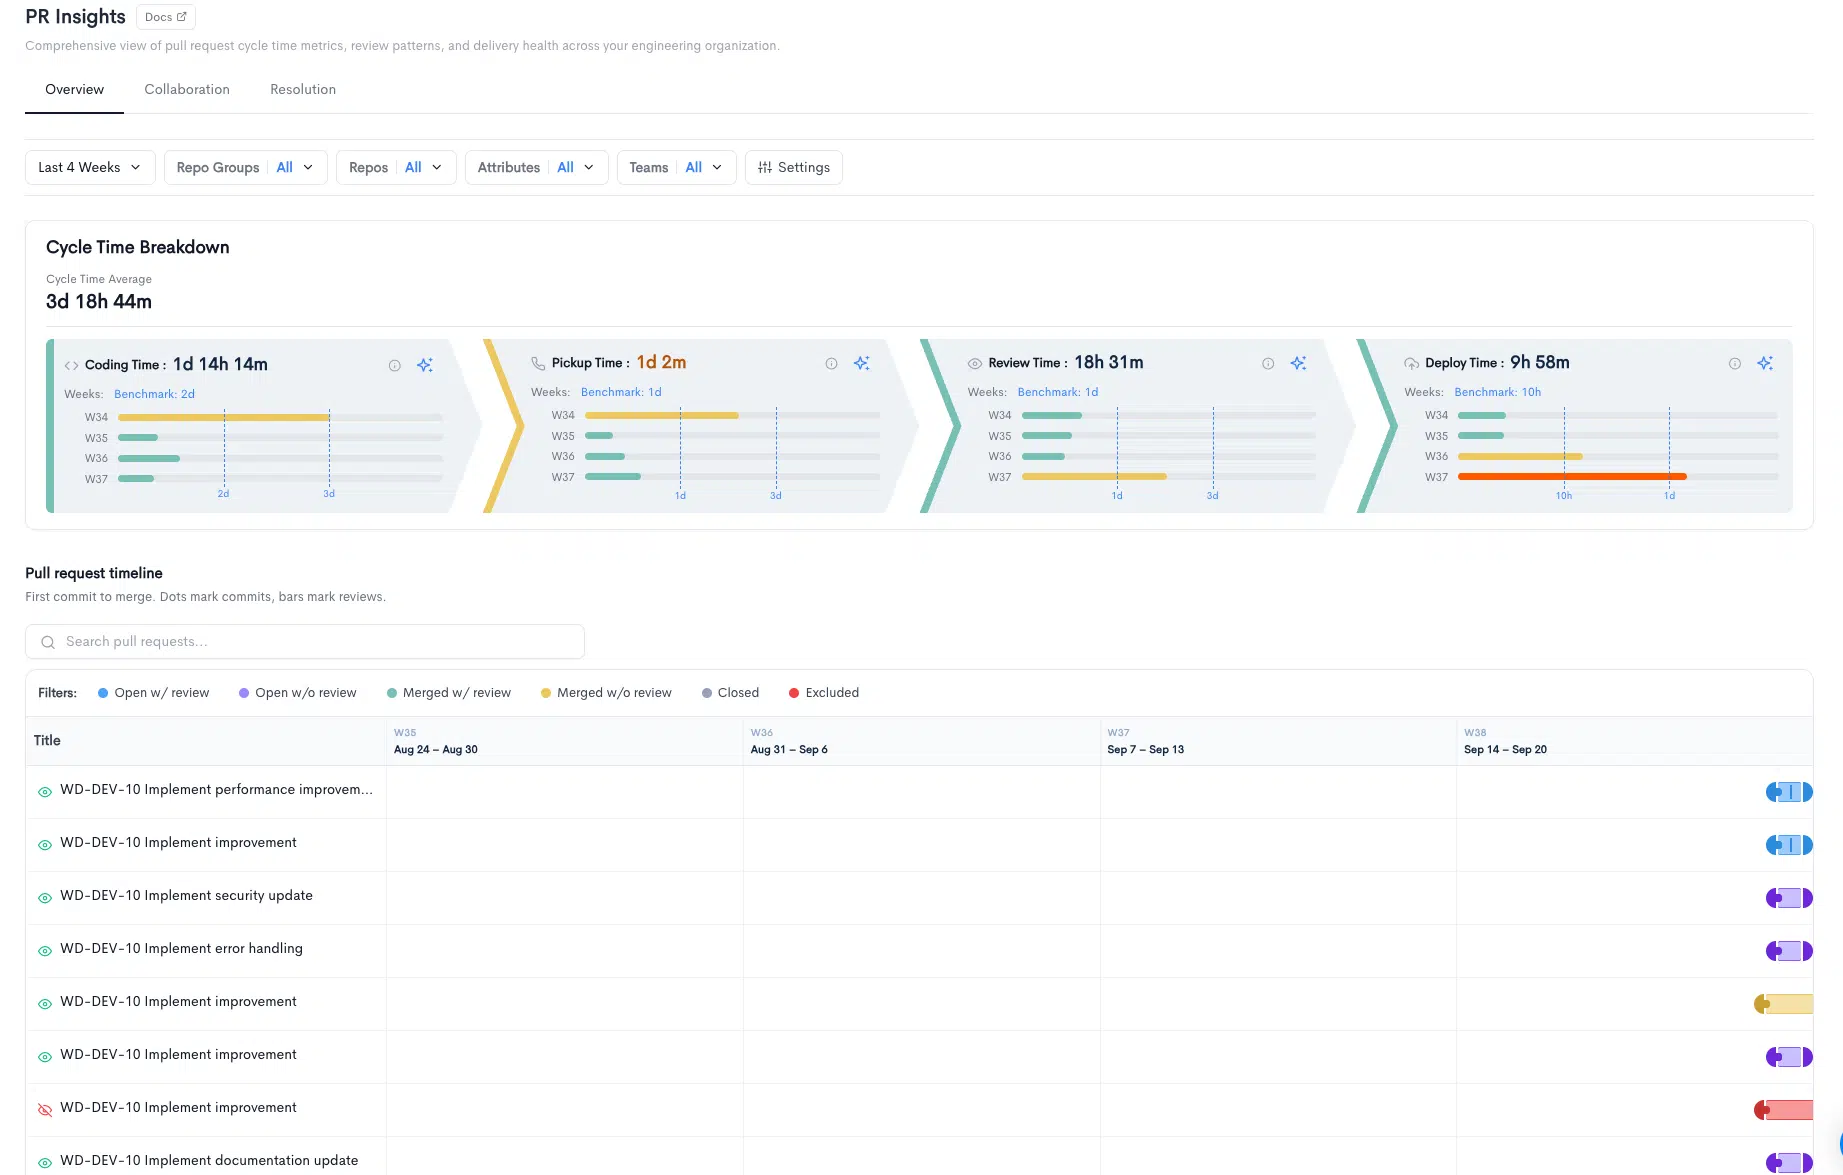
Cycle Time measures process speed. It’s the speed of your development time, how fast you can deliver a feature to the customer, from the moment work has started to the moment it’s been delivered.
Gain complete visibility into all Pull Requests within any timeframe through a single, intuitive dashboard.
Keep a pulse on your sprint progress. Visualize and mitigate sprint risk using our forecast model. Identify capacity issues and scope creep.
The Team Insights Report provides a comprehensive summary of your teams’ recent activities, enabling you to better understand their performance and progress.
The Benchmark feature allows you to asses your team’s performance in alignment with key company standards and metrics.
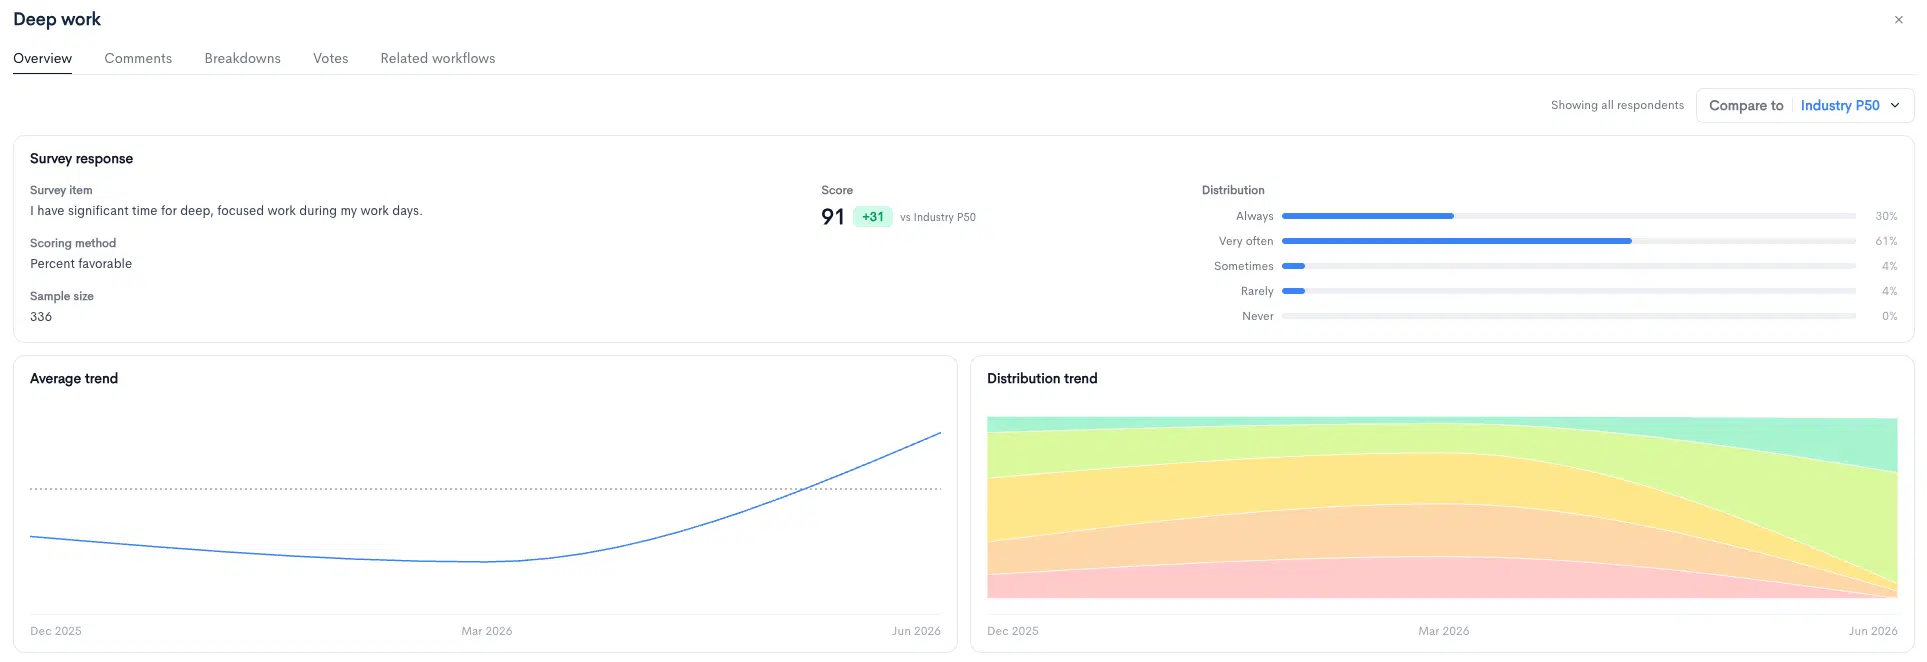
Developer Experience (DX), designed to give leaders the insights they need to identify the challenges their contributors face and unlock their full potential.
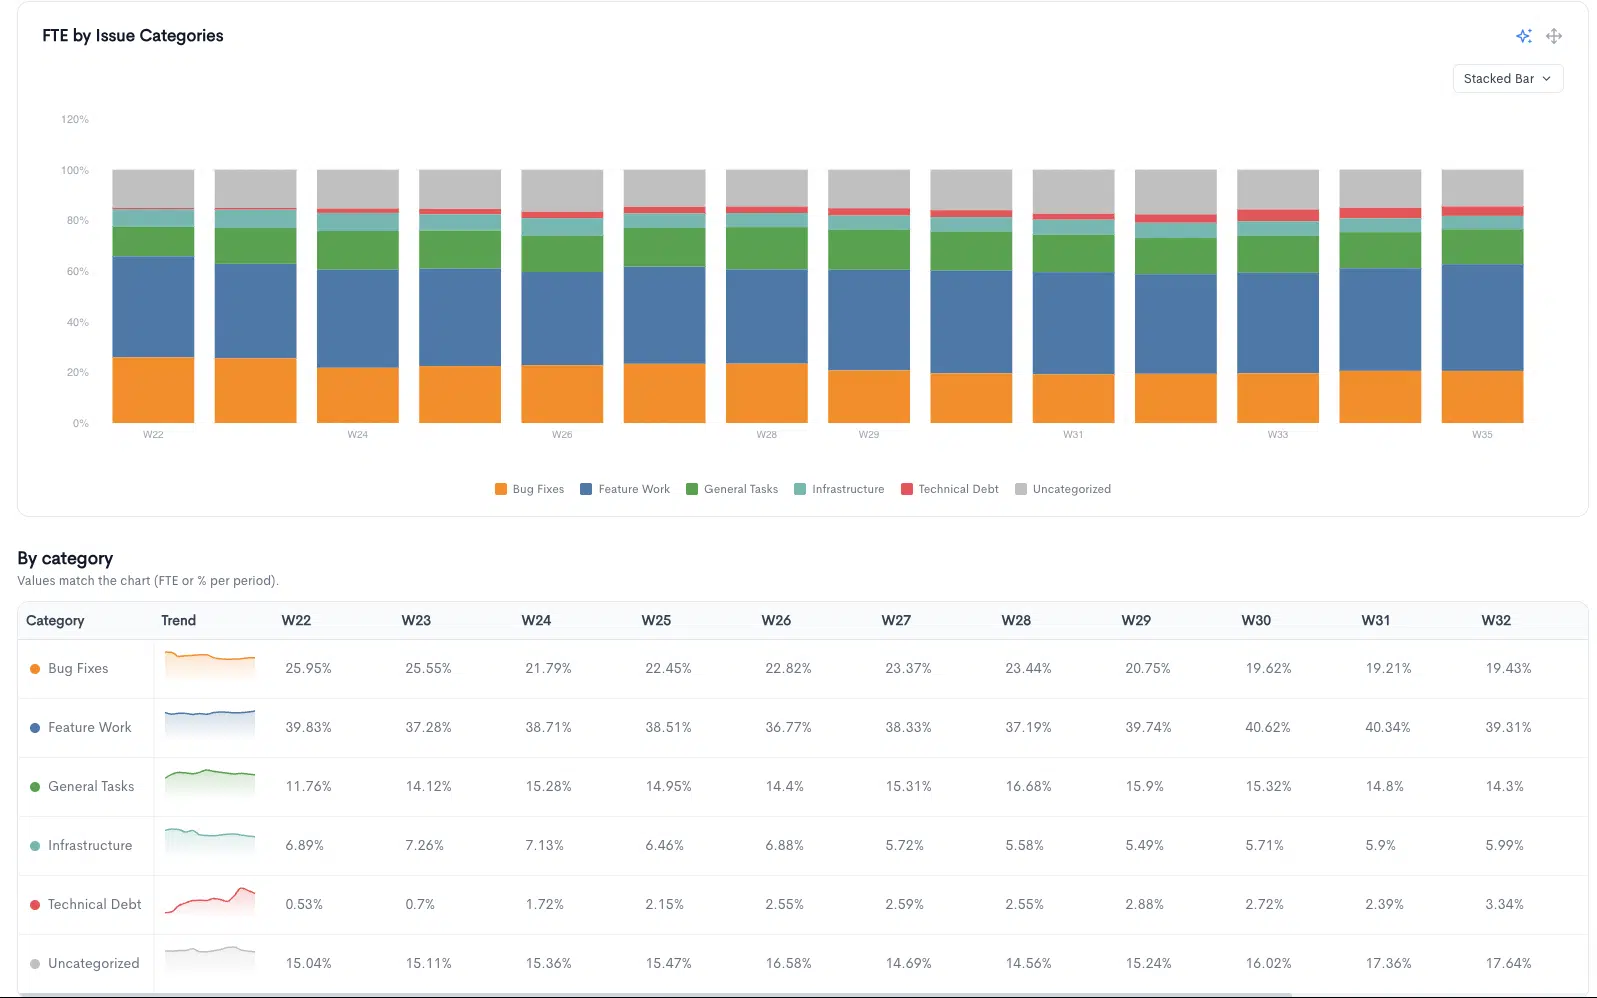
The Project Costs report provides insight into the progress and costs of key initiatives and deliverables to help teams ship on schedule. It correlates issue tracking system data with salary data to give you an overview of how much you spent on each issue and epic.
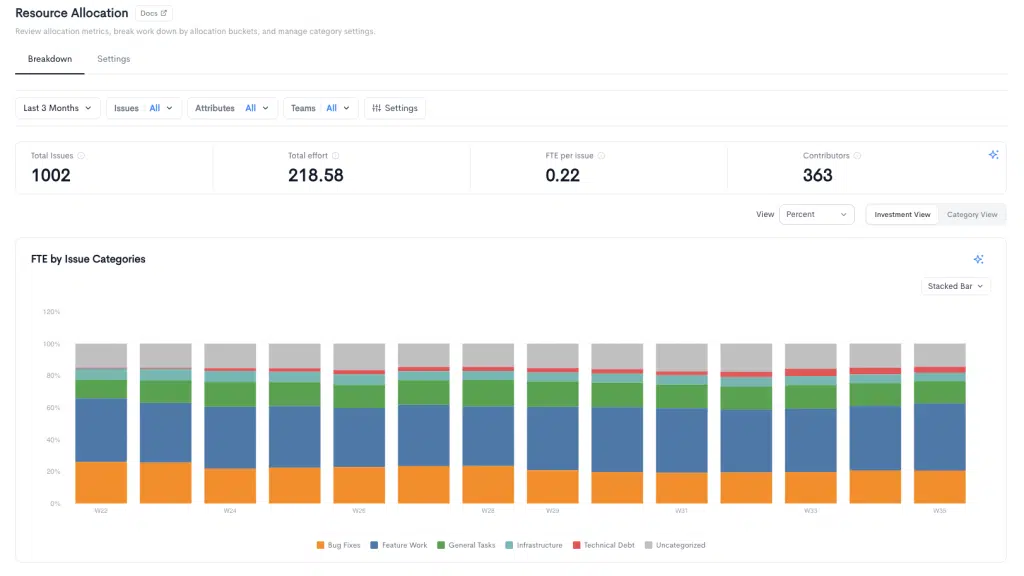
Get a better understanding of how well engineering resources are allocated, visualize financial costs, and have more control over the progress of key initiatives.
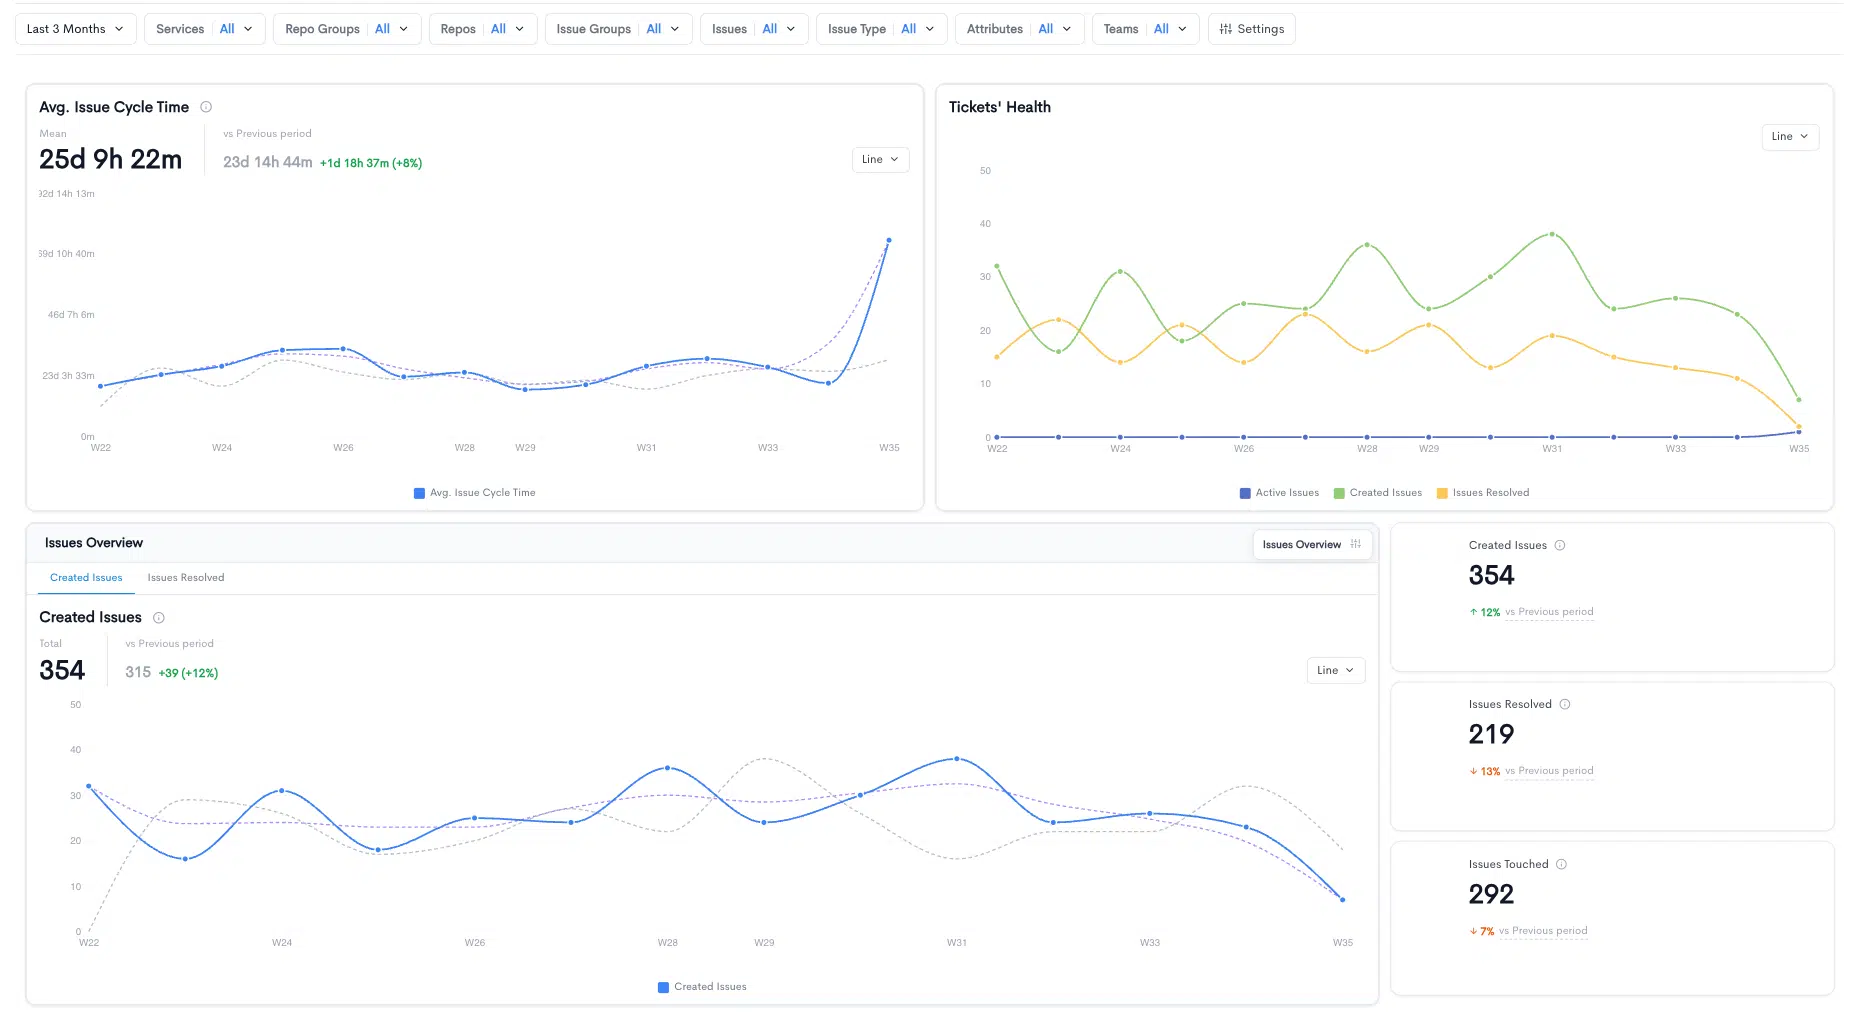
The Targets feature enables leaders to set and track ambitious, measurable goals and gain meaningful insights into progress.
For product leaders, connect the planned roadmap with issue-tracking progress, delivery flow and platform dependencies. Use source-backed engineering signals to assess release risk without treating work estimates as promises.
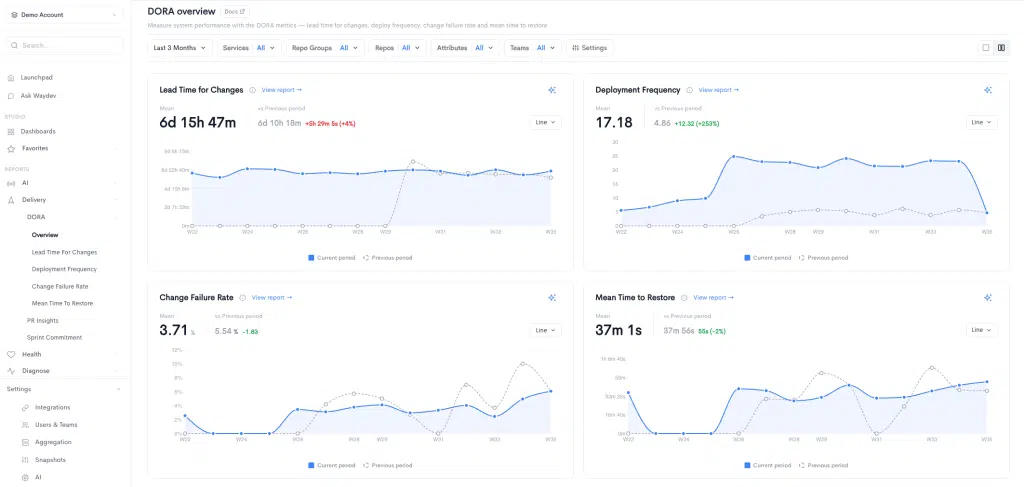
Explore delays and quality guardrails for important initiatives, then adjust priorities with your engineering partners.
Real static screenshots from Waydev feature pages, with illustrative data. No video players.
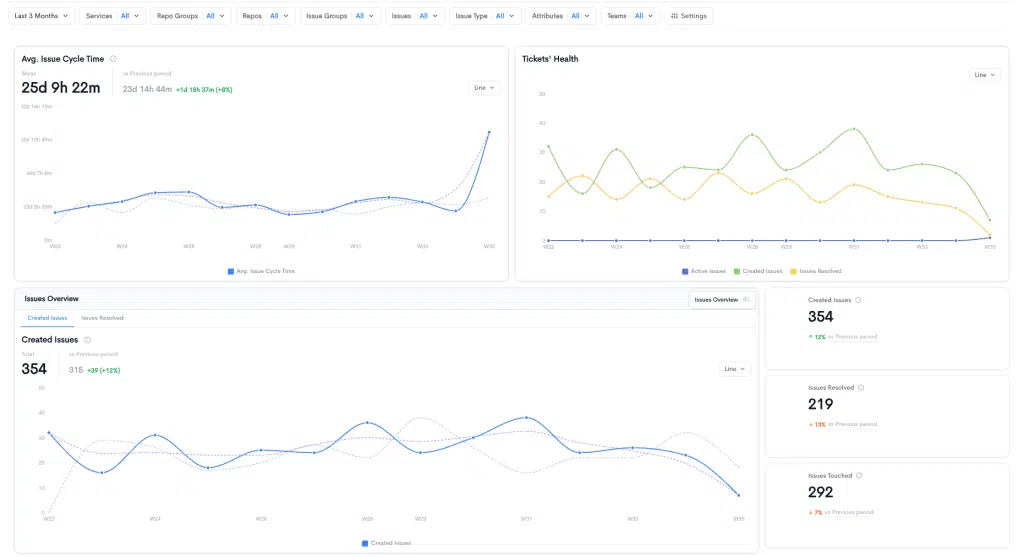
Why Waydev
No more guessing, get granular visibility to manage your team’s better with objective data.
Understand insights in real-time, reduce engineering cycle time and increase your development speed.
Improve efficiencies, speed up engineering excellence and drive up productivity.


Ready to unlock your SDLC productivity?